
| Company | Sep 25 | Oct 25 | Nov 25 | Dec 25 | Jan 26 | Feb 26 | Mar 26 | Apr 26 | May 26 | Jun 26 | Jul 26 | Aug 26 | 12-Mo |
|---|---|---|---|---|---|---|---|---|---|---|---|---|---|
| BORR | -8% | +15% | +7% | +22% | +16% | +31% | -6% | +5% | -17% | -18% | -2% | +11% | +54% |
| NE | -0% | +4% | +4% | -6% | +26% | +28% | +9% | +4% | -9% | -19% | +14% | +8% | +68% |
| VAL | -2% | +15% | +1% | -11% | +15% | +66% | +2% | +4% | -9% | -22% | +9% | +9% | +74% |
| NBR | +10% | +19% | +3% | +9% | +23% | +17% | +10% | +19% | -10% | -9% | +2% | +9% | +151% |
| TDW | -11% | -5% | +7% | -6% | +24% | +27% | +5% | +7% | -18% | -9% | +13% | +24% | +55% |
| RIG | +3% | +23% | +15% | -6% | +20% | +30% | +2% | +3% | -9% | -21% | +9% | +9% | +92% |
Source: Yahoo Finance monthly adjusted close.
Quick Thesis
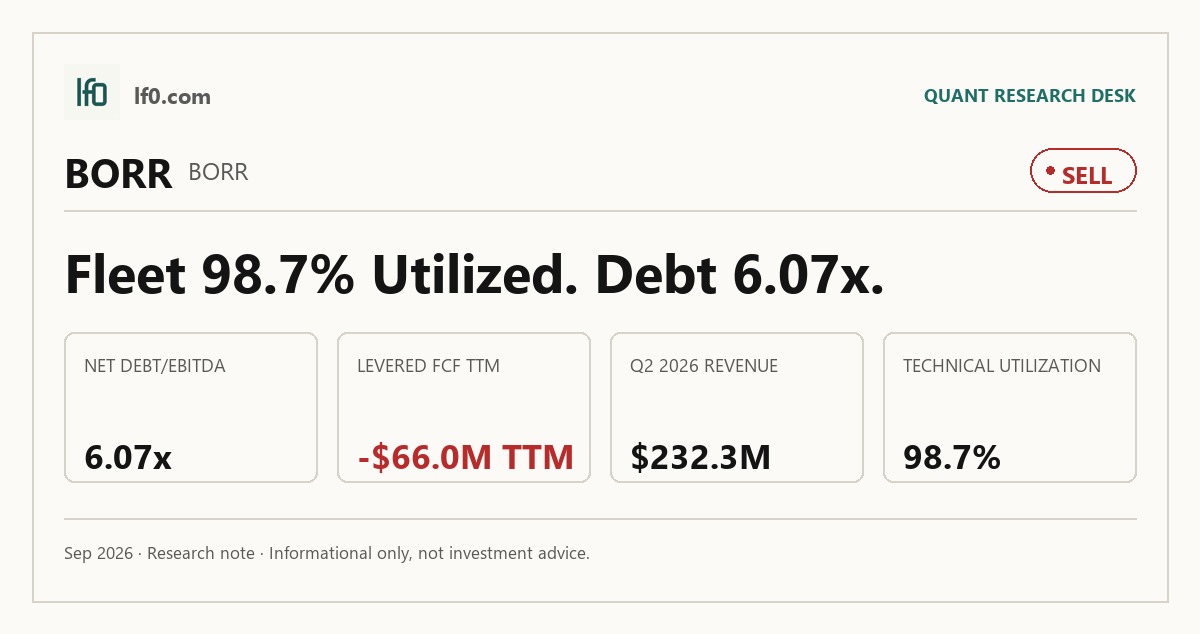
- Rated sell because the latest quarter showed a sharp EBITDA break and negative free cash flow.
- Strongest point: 98.7% technical utilization in 2025 supports the fleet-quality case.
- Biggest risk: 6.1x net debt/EBITDA leaves little room if dayrates soften again.
- Valuation looks rich at 3.6x EV/revenue with -4.7% FCF yield.
- I would turn more constructive only if quarterly EBITDA recovers above $100M.
Executive Summary
Rating: SELL | BORR
Measured from adjusted close on 2026-09-08 to 2026-10-22. Sell ratings are correct when the stock falls; Hold is tracked as a +/-10% range. Daily-close data, not intraday. Calls are tracked for 182 days from publication, then frozen as a final record.
I would put my rating as a sell because BORR’s fleet quality is not yet translating into durable equity value, and the latest quarter showed that gap widening rather than closing. The company still has a real operating edge in a young, premium jack-up fleet, but the sharp drop in EBITDA and the negative free cash flow tell me the market is paying for a recovery that has not been proven in the numbers.
What matters most now is whether quarterly revenue can hold above roughly $250M, meaning the recent run rate is no longer slipping, while levered free cash flow turns positive and stays there for two quarters. If that happens, I would become more constructive; if not, the current leverage profile will keep the equity fragile.
Company Profile
Borr Drilling Ltd. is an offshore shallow-water drilling contractor that owns and operates 29 premium jack-up rigs and earns most of its revenue through dayrate contracts with oil and gas exploration and production customers. It was incorporated in Bermuda in 2016, listed on the Oslo Stock Exchange in 2017, listed on the NYSE under BORR in 2019, delisted from Oslo in 2024, and relisted on Euronext Growth Oslo in 2025. The fleet has expanded through acquisitions and newbuild deliveries, and the company now operates across the Americas, Southeast Asia, West Africa, the Middle East and North Africa, and Europe.
Economic Moat
Business Model
The clearest structural advantage here is fleet quality. In my view, a younger premium jack-up fleet is hard to replicate quickly because it takes capital, time, and access to the right assets, and BORR’s 29-rig fleet is positioned around that scarcity. The company also benefits from fleet uniformity, which lets it bid multiple contracts at once and run a more efficient operating model than a mixed-fleet competitor.
That edge is visible in the operating data: 98.7% technical utilization in 2025 and a 1.95 TRIF show the fleet is being run well, not just marketed well. I also see the geographic spread as helpful, because 25 operating or committed rigs across six regions reduces dependence on any single basin even though the business still sells into a cyclical market.
Business & Operating Risks
The main disclosed risk is impairment on the jack-up fleet. According to the risk factors in their SEC 20-F, management concluded that impairment indicators existed for 13 jack-up rigs in 2025 and tested recoverability using an undiscounted cash flow model, with dayrate revenues and utilization as the key assumptions. That matters because the carrying value of jack-up drilling rigs was $2.7B at December 31, 2025, so even a modest shortfall in utilization or dayrates can force a write-down.
Customer concentration is the next pressure point. Eni accounted for 18.0% of operating revenues in 2025, PTT Exploration and Production for 11.0%, and Irish Energy Drilling Asset for 10.0%, so the top three customers represented 39.0% of operating revenues. Contract suspensions and terminations in Mexico reinforce that risk, because BORR’s dayrate model depends on specific rigs and counterparties rather than a broad recurring base.
Debt and covenant pressure remain material. As of December 31, 2025, BORR had $2.5B of total debt, and the senior secured revolving credit facility contains covenants on leverage, liquidity, equity, collateral, and interest cover. The risk is not abstract: interest expense was $228.4M in 2025, more than five times net income, so a weaker operating backdrop would hit cash flow quickly.
Geopolitical and counterparty risk in the Middle East and Mexico is also real. Four rigs were in the Middle East as of March 17, 2026, and the company was evaluating lost revenue and extra operating costs after the late-February conflict and the March 7 incident on Arabia III. That said, these risks do not directly undermine the fleet-quality moat itself; they mainly test whether BORR can keep that fleet earning through a volatile contract cycle.
Management Discussion & Analysis
Management is responding to the disclosed risks, but it is doing so by adding capacity and extending funding rather than by de-risking the balance sheet. The $360M Five-Rig Acquisition, the $165M 2030 Notes offering, the $84M equity offering, and the $150M seller’s credit all point to a strategy built around scale and liquidity, not deleveraging.
The problem is that the operating backdrop has not fully caught up. Backlog fell to $962.9M from $1.33B in 2024, and utilization slipped to 80.0% from 90.8%, so the company is not yet replacing backlog as fast as it is consuming it. Management is leaning on a tight-market narrative, but the latest numbers still look more like a bid to preserve scale than proof of a self-funding expansion cycle.
Recent Events
The most important recent events are the fleet acquisitions and the CEO transition. The January 2026 purchase of five rigs from Noble and the March 2026 joint-venture acquisition of five more rigs extend the same scale-building playbook, while the July 2025 announcement that Bruno Morand would succeed Patrick Schorn on September 1, 2025 suggests governance is being handled in an orderly way.
Those events matter for the moat because they deepen the fleet, but they also add execution risk at a time when utilization and backlog are already softer. In my view, the recent actions strengthen the asset base more than they strengthen the earnings base.
Financial Analysis
Growth
BORR — Financial Growth (Quarterly, USD Mil)
| Metric | 2025-06-30 | 2025-09-30 | 2025-12-31 | 2026-03-31 | 2026-06-30 |
|---|---|---|---|---|---|
| REVENUE (USD Mil) | 267.7 | 277.1 | 259.4 | 247 | 232.3 |
| EBIT (USD Mil) | 94.6 | 92.9 | 67.9 | 42 | -172.4 |
| EBITDA (USD Mil) | 131.3 | 130.5 | 105.7 | 84.5 | -128.9 |
| NET INCOME (USD Mil) | 35.1 | 27.8 | -1 | -29 | -241.4 |
| DILUTED EPS | 0.1 | 0.1 | 0 | -0.1 | -0.8 |
Source: Yahoo Finance — Quarterly Financial Statements
Revenue has rolled over after a modest mid-2025 peak. It rose to $277.1M in Q3 2025, then fell to $232.3M in Q2 2026, a 16.2% decline from the peak and a 13.0% drop from Q3 2025 to Q2 2026. EBITDA fell faster, from $130.5M in Q3 2025 to negative $128.9M in Q2 2026, which tells me the earnings break is deeper than the top-line decline alone suggests.
That matters for the thesis because the fleet can still look busy while cash generation weakens. The latest quarter looks like a real operating reset, not just normal seasonality, so I would not treat the revenue decline as a temporary wobble without clearer evidence.
Profitability
BORR — Profitability (TTM)
| Metric | TTM |
|---|---|
| Operating Margin (TTM) | 0.1% |
| Net Margin (TTM) | -24.0% |
| Return on Assets (TTM) | 3.8% |
| Gross Margin (TTM) | 43.7% |
| EBITDA Margin (TTM) | 36.7% |
Source: Yahoo Finance — Trailing Twelve Months (TTM)
TTM gross margin was 43.7% and EBITDA margin was 36.7%, which shows the rigs still earn healthy contribution before overhead and depreciation. The problem is below that line: operating margin was only 0.1%, and net margin was -24.0%, so most of the value is being consumed by depreciation, amortisation, interest, and corporate costs.
Return on assets was 3.8%, while return on equity was -24.7%, and that spread tells me leverage is amplifying a business that is not yet consistently profitable. The moat shows up in gross and EBITDA margin, but the equity case does not work until those margins translate into positive net income.
Valuation
BORR — Valuation Multiples
| Metric | Value |
|---|---|
| Market Cap (USD Mil) | 1,401 |
| Enterprise Value (USD Mil) | 3,664 |
| Forward P/E | 45.6 |
| Price/Sales (TTM) | 1.4 |
| Price/Book (mrq) | 1.5 |
| EV/Revenue | 3.6 |
| EV/EBITDA | 9.8 |
| Beta (5Y Monthly) | 1.02 |
| FCF Yield % (TTM) | -4.7% |
| Forward EPS (USD) | 0.1 |
| Analyst Target Price – Low (USD) | 3.5 |
| Analyst Target Price – Mean (USD) | 5.1 |
| Analyst Target Price – High (USD) | 6.2 |
| # Analyst Opinions | 6 |
Source: Yahoo Finance
BORR screens on cash flow and asset value, not earnings. EV/revenue is 3.6x, price/sales is 1.4x, and EV/EBITDA is 9.8x, which implies the market is paying for a drilling fleet that can keep dayrates and utilization high enough to support a recovery. That is not a cheap multiple for a business with -4.7% FCF yield and negative levered free cash flow.
I would put fair value in a range of about $3.5-$6.2 per share based on the peer multiple work and the current cash-flow profile, with the lower end reflecting the leverage burden and the upper end assuming the latest quarter proves temporary. That range sits broadly in line with the $3.5-$6.2 analyst target band from 6 opinions, so I do not think the market is wildly out of step with consensus; the issue is that consensus appears to be leaning on a recovery that still needs to show up in the numbers. On an EPS basis, I would frame fair value around $0.05-$0.15 per share, which is consistent with the current 0.10 forward EPS and still looks rich relative to peers that already convert earnings into stronger free cash flow.
Leverage
BORR — Leverage & Coverage (Quarterly)
| Metric | Value |
|---|---|
| Total Debt/Equity % (mrq) | 258.6 |
| Current Ratio (mrq) | 2.5 |
| Total Debt (mrq, USD Mil) | 2,486.8 |
| Levered Free Cash Flow (TTM, USD Mil) | -66 |
| Net Debt/EBITDA (TTM) | 6.1 |
| FCF Margin % (TTM) | -6.5% |
Source: Yahoo Finance — Quarterly Financial Statements
BORR’s leverage is elevated but still serviceable. Total debt/equity was 258.6%, current ratio was 2.5x, and total debt was $2.5B, which means the balance sheet is debt-heavy but not near-term distressed. Operating cash flow was $133.2M, but levered free cash flow was -$66M and FCF margin was -6.5%, so EBITDA is not converting into residual cash after interest and capex.
Net debt/EBITDA was 6.1x, a level that leaves limited room for a downturn before refinancing risk becomes more acute. That is why I see the leverage profile as the key constraint on the equity: the fleet can be busy and still fail to create shareholder value if cash generation does not improve.
Insider Activity
The insider record is one-sided: 3 open-market purchases and 0 open-market sales in the 2026-03-24 to 2026-04-16 window. The buying was concentrated in Director Troim Tor Olav, with another director also buying, which suggests alignment is improving rather than a single isolated signal.
I view that as a useful vote of confidence, but not a substitute for operating proof. Insider buying matters most when the fundamentals are already turning, and here the latest quarter still showed negative EBITDA and negative free cash flow.
Comparable Analysis
Growth
| Company | Revenue TTM (USD Mil) | Revenue Growth YoY % | Diluted EPS TTM |
|---|---|---|---|
| BORR | 1,015.8 | -13.2% | -0.8 |
| NE | 2,884.7 | -16.3% | 0.9 |
| VAL | 2,137.7 | -12.4% | 13.3 |
| NBR | 3,214.1 | -2.2% | 14.8 |
| TDW | 1,346.4 | -43.1% | 4.9 |
| RIG | 4,118 | -2.2% | -1.7 |
Source: Yahoo Finance
BORR’s revenue fell 13.2% TTM, versus -16.3% for NE, -12.4% for VAL, -2.2% for NBR, -43.1% for TDW, and -2.2% for RIG. That puts BORR in the middle of the pack, but not in the group of names showing the best revenue resilience, so I do not see a growth premium here.
Valuation
| Company | Trailing P/E | Forward P/E | EV/Revenue | EV/EBITDA | Price/Sales (TTM) | Price/Book (mrq) | Beta (5Y Monthly) | FCF Yield % (TTM) | Forward EPS | Analyst Target Price – Low | Analyst Target Price – Mean | Analyst Target Price – High | # Analyst Opinions |
|---|---|---|---|---|---|---|---|---|---|---|---|---|---|
| BORR | — | 45.6 | 3.6 | 9.8 | 1.4 | 1.5 | 1.02 | -4.7% | 0.1 | 3.5 | 5.1 | 6.2 | 6 |
| NE | 48.5 | 22.4 | 3 | 9.2 | 2.5 | 1.6 | 0.93 | 3.5% | 2 | 35 | 48 | 59 | 11 |
| VAL | 6.5 | 11.9 | 3.1 | 15.6 | 2.8 | 1.9 | 0.94 | 1.3% | 7.3 | 45 | 69 | 99 | 8 |
| NBR | 6.1 | 21.8 | 1.2 | 4.4 | 0.4 | 2.5 | 1.02 | 9.7% | 4.2 | 80 | 106.6 | 130 | 8 |
| TDW | 19.1 | 15.7 | 3.5 | 11.8 | 3.5 | 3.4 | 0.57 | 7.8% | 6 | 68 | 94.9 | 120 | 8 |
| RIG | — | 20.6 | 2.7 | 7.3 | 1.6 | 0.8 | 1.34 | 13.4% | 0.3 | 4.5 | 6.6 | 10 | 12 |
Source: Yahoo Finance
BORR trades at 3.6x EV/revenue, 45.6x forward P/E, 1.4x, and a -4.7% FCF yield, versus NE at 3.0x, 22.4x, 2.5x, and 3.5%, VAL at 3.1x, 11.9x, 2.8x, and 1.3%, NBR at 1.2x, 21.8x, 0.4x, and 9.7%, TDW at 3.5x, 15.7x, 3.5x, and 7.8%, and RIG at 2.7x, 20.6x, 1.6x, and 13.4%. BORR is priced richer than NBR on revenue and far weaker on cash generation, which is why I think the market is already giving it credit for a recovery that still needs to show up in earnings.
On a growth-adjusted basis, that looks less attractive than the headline multiple suggests. BORR’s leverage is also higher than most peers, so the valuation premium is not backed by a cleaner balance sheet.
Profitability
| Company | Operating Margin (TTM) | Net Margin (TTM) | Return on Assets (TTM) | Return on Equity (TTM) | Gross Margin (TTM) | EBITDA Margin (TTM) |
|---|---|---|---|---|---|---|
| BORR | 0.1% | -24.0% | 3.8% | -24.7% | 43.7% | 36.7% |
| NE | 10.7% | 5.2% | 3.1% | 3.3% | 35.4% | 32.7% |
| VAL | 9.8% | 44.0% | 3.3% | 33.6% | 24.8% | 19.9% |
| NBR | 7.5% | 7.7% | 3.3% | 22.3% | 38.4% | 27.5% |
| TDW | -8.7% | 18.3% | 7.0% | 19.4% | 48.1% | 29.6% |
| RIG | 17.4% | -40.2% | 3.5% | -18.7% | 41.6% | 37.3% |
Source: Yahoo Finance
BORR’s gross margin of 43.7% and EBITDA margin of 36.7% are competitive with NE, NBR, TDW, and RIG, but the company’s 0.1% operating margin and -24.0% net margin show that overhead and financing costs are still swallowing the operating spread. That is the key difference versus peers: the fleet can compete at the gross level, but BORR is not yet converting that into equity earnings the way the stronger names are.
Leverage
| Company | Total Debt/Equity % (mrq) | Current Ratio (mrq) | Total Debt (mrq, USD Mil) | Operating Cash Flow TTM (USD Mil) | Free Cash Flow TTM (USD Mil) | Net Debt/EBITDA (TTM) | FCF Margin % (TTM) |
|---|---|---|---|---|---|---|---|
| BORR | 258.6 | 2.5 | 2,486.8 | 133.2 | -66 | 6.1 | -6.5% |
| NE | 42.6 | 1.9 | 1,908.2 | 881.7 | 252.9 | 1.5 | 8.8% |
| VAL | 36.2 | 1.5 | 1,165.5 | 358.4 | 79.7 | 1.5 | 3.7% |
| NBR | 147.6 | 1.9 | 2,128.5 | 702.3 | 134.2 | 1.8 | 4.2% |
| TDW | 45.5 | 3.6 | 447.9 | 311.3 | 367.6 | 0 | 27.3% |
| RIG | 61.2 | 1.6 | 5,119 | 995 | 872.6 | 3 | 21.2% |
Source: Yahoo Finance
BORR’s 258.6% debt/equity and 6.1x net debt/EBITDA are heavier than NE’s 42.6% and 1.5x, VAL’s 36.2% and 1.5x, NBR’s 147.6% and 1.8x, TDW’s 45.5% and 0.0x, and RIG’s 61.2% and 3.0x. BORR’s -6.5% FCF margin also trails the peer set, while NE and RIG generate positive free cash flow margins, so the leverage profile is a financing risk rather than a competitive advantage.
Conclusion
The key tension is simple: BORR has a real fleet-quality edge, but the latest quarter showed that edge is not yet protecting equity value from a sharp earnings and cash-flow break. I would put my rating as a sell because the numbers still point to a business that is busy but not yet self-funding, and that is the standard that matters when leverage is this high.
I would raise my rating more towards a buy if quarterly revenue can hold above roughly $250M, meaning the recent run rate is no longer slipping, and if levered free cash flow turns positive for two straight quarters. That would tell me the fleet is not just working, but working hard enough to start repairing the balance sheet. I would also want to see quarterly EBITDA back above $100M, because that would show the Q2 2026 loss was an interruption rather than a reset in earnings power.
I would move from sell to hold if revenue stabilizes but free cash flow remains slightly negative, because that would at least show the operating break has stopped. By contrast, I would stay at sell if revenue remains below $240M per quarter and EBITDA stays negative, since that would confirm the market is still paying for a recovery that is not arriving.
Weighing both paths, I think the bear case is more likely to show up first because the latest quarter already delivered the break in EBITDA and free cash flow, while the balance sheet still has to absorb that weakness. The insider buying is a useful counterweight, but until it is matched by a return to positive free cash flow, I would treat the stock as a wait-and-see name rather than a fresh buy.
What to Watch Next
- Quarterly revenue above $250M — would support a move away from sell.
- Quarterly EBITDA above $100M — would show the Q2 2026 break was temporary.
- Levered free cash flow turning positive for two quarters — would improve balance-sheet flexibility.
- Net debt/EBITDA falling materially below 6.1x — would reduce refinancing risk.
- Backlog rebuilding from $962.9M — would signal the fleet is replacing work faster.
What’s your take? I rated Borr Drilling (BORR) SELL above — but the goal here is to get this right, not just to publish an opinion. What would you add to this analysis, or which risk or catalyst do you think I’m under- or over-weighting? Tell me in the comments.
Sources
- SEC Form 4 Insider Transaction (2026-04-17)
- SEC Form 4 Insider Transaction (2026-03-26)
- SEC Form 4 Insider Transaction (2026-03-26)
Data sourced from Yahoo Finance and SEC EDGAR. Not investment advice.
Leave a Comment