
Executive Summary
Rating: HOLD | TGT
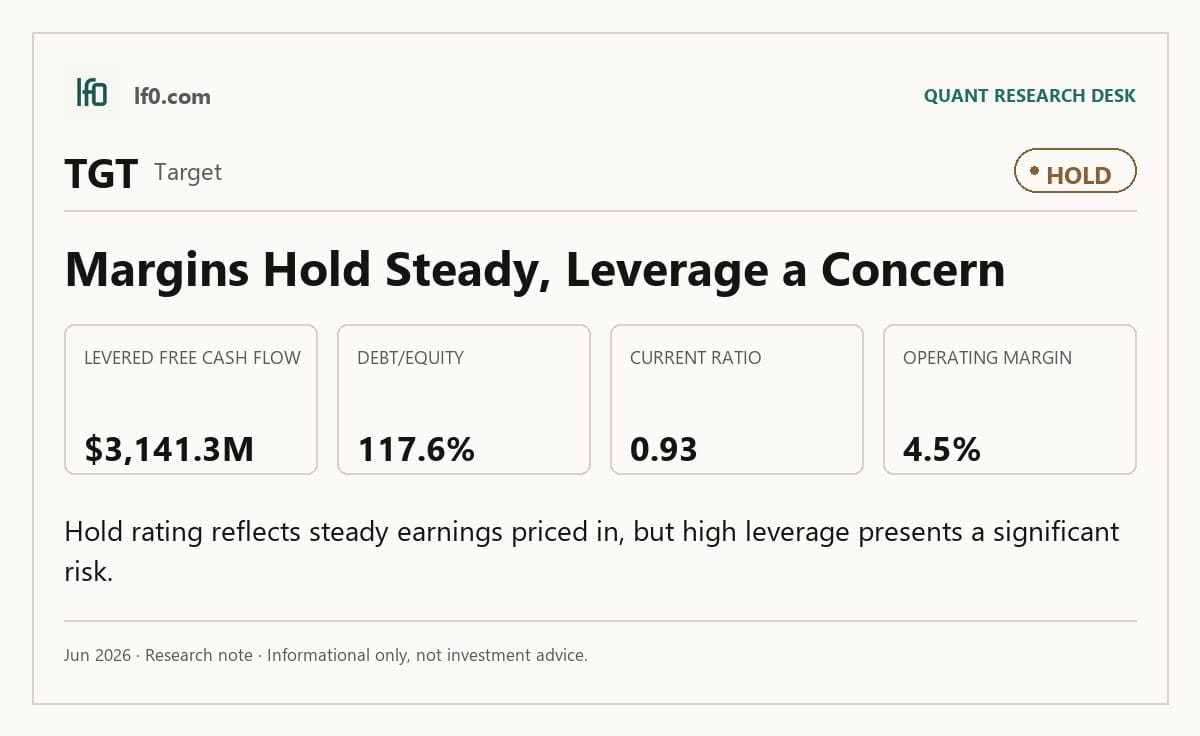
I would put my rating as a Hold because Target is profitable and cash generative, but the current setup does not yet justify a more bullish call. The company’s TTM operating margin is 4.5% and net margin is 3.2%, which tells me the business is healthy but still operating with limited room for error after a 33.0% 52-week share-price gain. I would raise my rating more towards a Buy if operating margin stays above 4.0% for several quarters, meaning the earnings base is holding through normal periods rather than only in holiday strength.
Company Profile
Target Corporation was incorporated in Minnesota in 1902 and operates a single retail segment that sells merchandise and everyday essentials through stores and digital channels. It earns most revenue from merchandise sales, with additional income from advertising through Roundel, a retail media network, credit card profit sharing, Target Plus marketplace fees, and in-store partnerships such as CVS Pharmacy, which runs pharmacies and clinics under a perpetual operating agreement. The company has given 5% of profit to communities since 1946. It is listed on the New York Stock Exchange under TGT.
Target operates nearly all of its business in the U.S., with global sourcing offices in 12 countries and administrative functions in Bangalore, India. As of January 31, 2026, it employed about 415,000 team members across stores, supply chain facilities, and support roles. Stores fulfill more than 97% of merchandise sales, and the company uses them as fulfillment hubs for pickup, Drive Up, and same-day delivery.
Economic Moat
Business Model
Stores acting as fulfillment hubs are the clearest structural advantage in Target’s model. More than 97.0% of merchandise sales were fulfilled through stores in each of the last 3 years, and I feel that a competitor would struggle to replicate that network quickly because it requires dense store coverage, inventory placement, and last-mile execution at the same time. That network supports Order Pickup, Drive Up, and Same Day Delivery, so it improves speed and convenience rather than just lowering cost.
A second moat element is the owned-and-exclusive brand portfolio, which is about 30.0% of merchandise sales and gives Target more control over assortment and margin mix. The Target Circle loyalty stack and Roundel retail media network add another layer, but I see them as supporting assets rather than the core defense.
Business & Operating Risks
A high-severity risk is customer and vendor concentration around Target’s reputation and merchandising choices. According to the risk factors in its SEC 10-K, negative reactions to the 2025 changes to diversity, equity, and inclusion initiatives led to consumer boycotts organized throughout 2025, and similar backlash over Pride Month products in 2023 also hurt sales. Because the same brand perception affects guests, vendors, and collaborators, a reputational hit can quickly become a traffic and sourcing problem.
A medium-severity risk is tariff and import exposure. About one-half of merchandise is sourced directly or indirectly from outside the U.S., with China as the largest source, so new Section 122 tariffs or any loss of the first sale declaration program would raise landed costs and pressure margin rate.
Inventory shrink is another high-severity risk. Target says sustained shrink from theft, damage, and organized retail crime has already contributed to store closures and long-lived asset impairments, which means margin pressure can turn into permanent capital loss.
Technology and cybersecurity disruption is a medium-severity risk. The company has already had order-fulfillment and point-of-sale outages, and any breach or system failure could block transactions, disrupt inventory control, and trigger enforcement or litigation.
Management Discussion & Analysis
Management is signaling that capital is still being directed toward stores, supply chain, and technology, with 2026 capex set at about $5B. To me, that says Target is defending traffic and fulfillment speed before maximizing near-term cash returns. The plan to open about 30 new stores in 2026, after 18 openings in 2025, suggests management still sees white space in the physical network, but the pace is disciplined rather than aggressive.
On financing, Target issued $1B of unsecured debt in March 2025 and another $1B in June 2025, then repaid $1.5B in April 2025. I read that as active balance-sheet management rather than de-risking. The new $1B 364-day revolving credit facility, alongside the $3B 2028 revolver, is a liquidity backstop, not a sign of stress.
Recent Earnings
Revenue moved from $23.8B in Q1 2025 to $25.2B in Q2, $25.3B in Q3, $30.5B in Q4, and $25.4B in Q1 2026. That pattern is seasonal, not linear, and the Q4 spike followed by a Q1 reset tells me the business still leans heavily on holiday demand. EBITDA followed the same shape, rising to $2.2B in Q4 before easing to $2B in Q1, so the quarter did not show a clean step-up in underlying profitability.
The more important read-through is that Target is still using its store network to absorb demand swings rather than showing a smooth compounding trend. That is consistent with the moat, but it also means investors should not over-interpret one strong quarter as proof that the operating model has fully reset.
Financial Analysis
Growth
TGT — Financial Growth (Quarterly, USD Mil)
| Metric | 2025-04-30 | 2025-07-31 | 2025-10-31 | 2026-01-31 | 2026-04-30 |
|---|---|---|---|---|---|
| REVENUE (USD Mil) | 23,846 | 25,211 | 25,270 | 30,453 | 25,443 |
| EBIT (USD Mil) | 1,498 | 1,334 | 974 | 1,407 | 1,150 |
| EBITDA (USD Mil) | 2,285 | 2,105 | 1,747 | 2,210 | 1,963 |
| NET INCOME (USD Mil) | 1,036 | 935 | 689 | 1,045 | 781 |
| DILUTED EPS | 2.3 | 2 | 1.5 | 2.3 | 1.7 |
Source: Yahoo Finance — Quarterly Financial Statements
Revenue was $25.4B in Q1 2026, up 6.7% year over year, after a $30.5B holiday quarter that was far above the surrounding run rate. EBITDA was $2B in the latest quarter, and net income was $781M, which tells me growth is still real but not yet translating into a step-change in earnings power. The seasonal pattern matters because it shows Target can still drive traffic through the store base, but the thesis depends on that strength carrying into ordinary quarters.
Profitability
TGT — Profitability (TTM)
| Metric | TTM |
|---|---|
| Operating Margin (TTM) | 4.5% |
| Net Margin (TTM) | 3.2% |
| Return on Assets (TTM) | 5.7% |
| Return on Equity (TTM) | 22.0% |
Source: Yahoo Finance — Trailing Twelve Months (TTM)
Target’s TTM operating margin of 4.5%, net margin of 3.2%, ROA of 5.7%, and ROE of 22.0% show a profitable, mature retailer rather than a company still in build-out mode. The gap between operating and net margin is modest, so I weight operating margin and ROA most heavily; they show the core business is still converting sales into earnings even after tariff pressure. That margin profile is also consistent with the fulfillment-hub advantage described above, because the store network supports convenience but does not create a high-margin model.
Valuation
TGT — Valuation Multiples
| Metric | Value |
|---|---|
| Market Cap (USD Mil) | 60,912 |
| Enterprise Value (USD Mil) | 76,650 |
| Trailing P/E | 17.7 |
| Forward P/E | 15 |
| Price/Sales (TTM) | 0.6 |
| Price/Book (mrq) | 3.7 |
| EV/Revenue | 0.7 |
| EV/EBITDA | 9.2 |
| Beta (5Y Monthly) | 0.99 |
| FCF Yield % (TTM) | 5.2% |
| Forward EPS (USD) | 8.9 |
| Analyst Target Price – Low (USD) | 92 |
| Analyst Target Price – Mean (USD) | 133.1 |
| Analyst Target Price – High (USD) | 162 |
| # Analyst Opinions | 34 |
Source: Yahoo Finance
Target trades at 0.7x EV/revenue, 9.2x EV/EBITDA, 17.7x trailing P/E, and 15.0x forward P/E, while FCF yield is 5.2%. I think that is a fair price for a mature retailer with a 4.5% operating margin and a 0.99 beta, but not a clear bargain given the 117.5% debt/equity ratio and 0.9x current ratio. On the analysis here, I would put fair value in a range of about $88-$237 per share, which is wide because the peer multiple set spans a broad range of operating quality and balance-sheet strength.
That range sits inside the analyst consensus band of $92–$162, and the $133 mean target is close enough to my view that I do not need to fight the street aggressively. Forward EPS is 8.9, which is richer than WMT’s $3.3 and DLTR’s $7.6, so the market is paying for a stronger earnings base rather than a cheap multiple alone. I would not call the stock cheap, but I also do not think the current valuation fully discounts the leverage and margin constraints.
Leverage
TGT — Leverage & Coverage (Quarterly)
| Metric | Value |
|---|---|
| Total Debt/Equity % (mrq) | 117.5 |
| Current Ratio (mrq) | 0.9 |
| Total Debt (mrq, USD Mil) | 19,272 |
| Operating Cash Flow (TTM, USD Mil) | 7,003 |
| Levered Free Cash Flow (TTM, USD Mil) | 3,141.2 |
Source: Yahoo Finance — Quarterly Financial Statements
Target carries $19.3B of total debt against a 0.9 current ratio and 117.5% debt/equity, so the balance sheet is tight even though it is not distressed. TTM operating cash flow was $7B and levered free cash flow was $3.1B, which gives it real cash generation to service obligations and fund the roughly $5B capital plan. The key point is that leverage is manageable only if cash flow stays steady; if margins slip, the balance sheet will stop being a neutral feature and start limiting flexibility.
Comparable Analysis
Growth
| Company | Revenue TTM (USD Mil) | Revenue Growth YoY % | EBITDA TTM (USD Mil) | Diluted EPS TTM |
|---|---|---|---|---|
| TGT | 106,377 | 6.7% | 8,344 | 7.6 |
| WMT | 725,305 | 7.3% | 44,838 | 2.8 |
| COST | 293,587 | 21.5% | 13,790 | 19.9 |
| DLTR | 19,747.9 | 7.2% | 2,405.3 | 6.2 |
| BJ | 21,965.3 | 9.9% | 1,118.8 | 4.3 |
| KR | 148,645 | 2.2% | 8,080 | 1.7 |
Source: Yahoo Finance
Target’s revenue growth of 6.7% TTM sits just below WMT’s 7.3% and DLTR’s 7.2%, but well behind COST’s 21.5% and ahead of KR’s 2.2%. I read that as a middle-ground growth profile for a mature mass-market retailer: the discount to COST is justified by COST’s much faster top-line expansion, while Target’s slight edge over KR does not support a premium growth multiple.
Valuation
| Company | Trailing P/E | Forward P/E | EV/Revenue | EV/EBITDA | Price/Sales (TTM) | Price/Book (mrq) | Market Cap (USD Mil) | Enterprise Value (USD Mil) | Beta (5Y Monthly) | FCF Yield % (TTM) | Forward EPS | Analyst Target Price – Low | Analyst Target Price – Mean | Analyst Target Price – High | # Analyst Opinions |
|---|---|---|---|---|---|---|---|---|---|---|---|---|---|---|---|
| TGT | 17.7 | 15 | 0.7 | 9.2 | 0.6 | 3.7 | 60,912 | 76,650 | 0.99 | 5.2% | 8.9 | 92 | 133.1 | 162 | 34 |
| WMT | 42 | 36.3 | 1.4 | 22.8 | 1.3 | 10.1 | 950,354 | 1,021,815 | 0.60 | 0.7% | 3.3 | 70 | 138.7 | 155 | 40 |
| COST | 48.1 | 42.3 | 1.4 | 30.7 | 1.4 | 25.7 | 424,711 | 423,024 | 0.87 | 1.6% | 22.6 | 740 | 1,082.9 | 1,315 | 33 |
| DLTR | 18.2 | 14.8 | 1.4 | 11.8 | 1.1 | 6.3 | 21,795 | 28,381 | 0.66 | 6.6% | 7.6 | 85 | 125 | 165 | 24 |
| BJ | 19.8 | 17.6 | 0.6 | 12.4 | 0.5 | 5.2 | 10,998 | 13,832 | 0.23 | 0.8% | 4.9 | 79 | 101.1 | 120 | 20 |
| KR | 33.4 | 10.3 | 0.4 | 8.1 | 0.2 | 6.2 | 34,972 | 65,783 | 0.42 | 8.6% | 5.5 | 58 | 70.7 | 85 | 21 |
Source: Yahoo Finance
Target’s $3.1B FCF yield is far richer than WMT’s 0.7% and COST’s 1.6%, and it also exceeds BJ’s 0.8% and KR’s 8.6% only in the sense that KR is the outlier on cash yield, not on quality. The stock’s 45.0% 1-year total return also stands well ahead of WMT’s 23.0%, COST’s -4.1%, DLTR’s 12.8%, BJ’s -25.0%, and KR’s -21.3%, which tells me the market has already rewarded the recovery before it is fully proven in ordinary quarters. On a growth-adjusted basis, that makes Target look less cheap than the headline cash yield suggests.
Profitability
| Company | Operating Margin (TTM) | Net Margin (TTM) | Return on Assets (TTM) | Return on Equity (TTM) |
|---|---|---|---|---|
| TGT | 4.5% | 3.2% | 5.7% | 22.0% |
| WMT | 4.2% | 3.1% | 6.8% | 24.1% |
| COST | 3.7% | 3.0% | 8.7% | 29.2% |
| DLTR | 9.1% | 6.5% | 6.7% | 34.0% |
| BJ | 3.7% | 2.6% | 6.8% | 27.9% |
| KR | 3.2% | 0.7% | 5.8% | 13.8% |
Source: Yahoo Finance
Target’s operating margin of 4.5% and net margin of 3.2% are slightly ahead of WMT’s 4.2% and 3.1%, but below DLTR’s 9.1% and 6.5%. ROE of 22.0% trails COST’s 29.2% and DLTR’s 34.0%, while still staying above KR’s 13.8%. That spread says Target is not the most efficient capital user in the group, but it is still generating respectable returns for a retailer with a heavier balance sheet.
Leverage
| Company | Total Debt/Equity % (mrq) | Current Ratio (mrq) | Total Debt (mrq, USD Mil) | Operating Cash Flow TTM (USD Mil) | Free Cash Flow TTM (USD Mil) |
|---|---|---|---|---|---|
| TGT | 117.5 | 0.9 | 19,272 | 7,003 | 3,141.2 |
| WMT | 74.8 | 0.8 | 75,545 | 40,892 | 6,862.2 |
| COST | 60.3 | 1.1 | 10,228 | 15,000 | 6,954.4 |
| DLTR | 216.5 | 1.2 | 7,593.3 | 2,615.2 | 1,443.6 |
| BJ | 134.6 | 0.7 | 2,861.5 | 961.9 | 89.2 |
| KR | 373.4 | 0.8 | 24,192 | 6,936 | 3,015.5 |
Source: Yahoo Finance
Target’s debt/equity of 117.5% is above WMT’s 74.8% and COST’s 60.3%, but below DLTR’s 216.5% and KR’s 373.4%. I view that as a deliberate financing choice rather than a distress signal, because Target still has $7B of operating cash flow and $3.1B of free cash flow TTM, or about $15.4 and $6.9 per share, which gives it room to service debt and support the dividend. Compared with peers, the leverage profile is not the worst in the group, but it does cap how much valuation upside the market should assign to the stock.
Conclusion
I would put my rating as a Hold because Target has enough cash generation to support the dividend and fund investment, but not enough margin durability to justify a more aggressive stance. The business is still profitable, and the store-led fulfillment network remains a real structural advantage, yet the latest quarter also showed how dependent results are on seasonal demand and how quickly revenue falls back after the holiday peak.
I would raise my rating more towards a Buy if operating margin stayed above 4.0% for several quarters and levered free cash flow held near $3.1B, because that would show the current earnings base is durable rather than seasonal. A cleaner signal would be revenue holding above $25B in non-holiday quarters while the company keeps funding about $5B of annual capex without pushing the current ratio below 0.9x, which would tell me the store network is still supporting traffic and cash generation at the same time.
I would move from Hold to Sell if the current ratio slipped materially below 0.9x, meaning short-term liquidity is tightening, and operating margin fell back toward 4.0% or lower. I would also turn more cautious if the next few quarters show revenue growth slowing back toward the low-single-digit range while debt stays near $19.3B, since that combination would leave less room to defend the dividend and would make the current valuation harder to justify.
Weighing both sides, I lean to the Hold case because the bull path needs proof that Target can keep margins near current levels without holiday help, while the bear case needs only a modest deterioration in liquidity or margin rate to matter. The stock can work from here, but I think the market is already giving credit for a recovery that still has to be repeated in ordinary quarters, not just in Q4.
What’s your take? I rated Target (TGT) HOLD above — but the goal here is to get this right, not just to publish an opinion. What would you add to this analysis, or which risk or catalyst do you think I’m under- or over-weighting? Tell me in the comments.
Data sourced from Yahoo Finance. Not investment advice.
Leave a Reply