Expected price range
Each range is set from the stock’s recent price history and our Hold rating, using its own 1-year realised volatility (84% annualised) as the width of a ~68% statistical band, and checked against that rating so the range leans the same way as our view. Starting price $5.93 (close 2026-11-17). The stock traded between $5.93 and $19.54 over the last 6 months and between $5.93 and $27.72 over the last year. This is an illustration of where our view and normal volatility point, not a forecast, price target or investment advice; the stock can move outside it.
| Company | Nov 25 | Dec 25 | Jan 26 | Feb 26 | Mar 26 | Apr 26 | May 26 | Jun 26 | Jul 26 | Aug 26 | Sep 26 | Oct 26 | 12-Mo |
|---|---|---|---|---|---|---|---|---|---|---|---|---|---|
| UUUU | -30% | +1% | +54% | -5% | -14% | +19% | -16% | -20% | -21% | +29% | -25% | -30% | -62% |
| UEC | -19% | -5% | +48% | -11% | -12% | +10% | -8% | -23% | -10% | +27% | -23% | -18% | -49% |
| LEU | -29% | -6% | +15% | -27% | -14% | +22% | -14% | -8% | +5% | -3% | -19% | -26% | -72% |
| DNN | -19% | +4% | +49% | +6% | -16% | +8% | -9% | -12% | -8% | +21% | -24% | -15% | -30% |
| ET | +1% | -1% | +12% | +4% | +2% | +5% | -3% | -0% | +6% | +7% | -8% | +6% | +34% |
Source: Yahoo Finance monthly adjusted close.
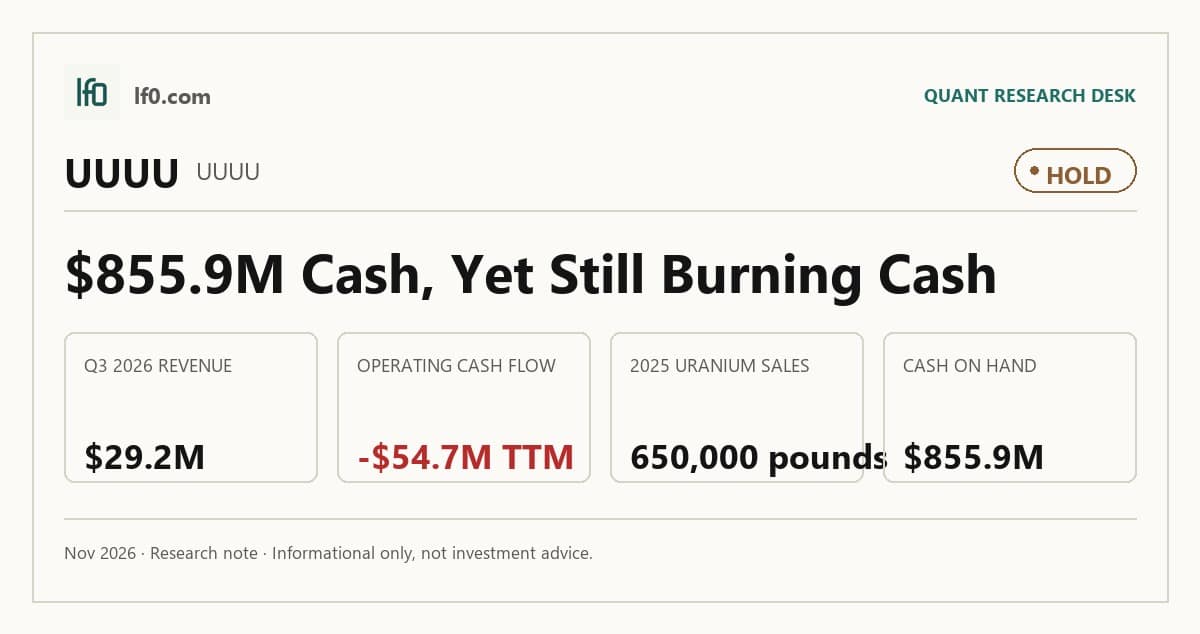
Quick Thesis
- Rated hold — White Mesa is unique, but cash burn is still the core issue.
- Strongest balance-sheet support: $855.9M cash versus $683.2M debt.
- Biggest risk: TTM levered free cash flow of -$91.7M.
- Valuation looks rich at 12.2x EV/revenue and 13.4x forward P/E.
- I would turn more constructive if operating cash flow moves toward positive territory.
Executive Summary
We’ll begin tracking this call’s performance since publication once sufficient adjusted-close data is available.
I would put my rating as a Hold because Energy Fuels owns a genuinely scarce processing asset, but that advantage is not yet translating into positive cash generation. White Mesa gives the company a structural edge in uranium and separated rare earth processing, yet the business still posted TTM operating cash flow of -$54.7M and levered free cash flow of -$91.7M, so the market is paying for optionality rather than proven earnings power. In my view, the key question is not whether the asset base is interesting; it is whether that asset base can start funding itself.
I would become more constructive if uranium sales and REE feedstock volumes lift quarterly revenue above the current $29.2M run rate and push operating cash flow toward positive territory, because that would show the Mill is moving from strategic asset to earnings engine. Until then, the stock looks ahead of the cash flow profile.
Company Profile
Energy Fuels produces uranium, vanadium, rare earth elements, and heavy mineral sands through three segments: uranium, rare earth elements, and heavy mineral sands. Its White Mesa Mill in Utah is the only licensed U.S. uranium mill and the only U.S. mill capable of separated rare earth production, and it also processes alternate feed materials, meaning uranium-bearing materials sourced from third parties. The company was incorporated in 1987, changed names several times, acquired Energy Fuels Resources Corporation in 2006, and adopted the Energy Fuels name that same year.
The company is headquartered in Lakewood, Colorado, with U.S. operations run through Energy Fuels Resources (USA) Inc. It owns or controls uranium mines and projects in Arizona, Utah, Colorado, New Mexico, and Wyoming, plus heavy mineral sands and rare earth projects in Brazil, Madagascar, Australia, and Kenya. It acquired RadTran LLC in 2024 to expand into medical isotopes, and it is pursuing Australian Strategic Materials through a 2026 acquisition agreement.
Economic Moat
Business Model
White Mesa is the clearest source of structural advantage here. In my view, it is hard to replicate quickly because a competitor would need to secure a comparable uranium milling license, build the plant, and obtain the approvals needed to process monazite and other uranium-bearing feedstocks. That makes the mill more than a single-commodity asset: it can process uranium, vanadium, rare earth products, and potentially radioisotopes for medical applications, while the alternate feed program recovers uranium from third-party material that would otherwise be discarded.
The moat has also widened beyond the original western U.S. uranium base. The company has moved from a domestic uranium and vanadium platform into a three-segment structure with a broader geographic footprint, and that shift matters because it gives White Mesa more feedstock paths and more end markets. I think that is a real strategic improvement, even if it has also made execution more complex.
Business & Operating Risks
The biggest disclosed risk is commodity price exposure. Energy Fuels says its earnings and operating cash flow are particularly sensitive to uranium, vanadium, rare earths, metals and alloys, and heavy mineral sands prices, and it warns that if prices fall below cash costs for a sustained period it may stop commercial extraction or recovery at some projects. That risk is not abstract: the company’s TTM operating cash flow was -$54.7M and levered free cash flow was -$91.7M, so the business still depends on favorable pricing and utilization to keep the model moving in the right direction.
Feedstock and project execution risk is the other major pressure point. The company is completely dependent on contractual arrangements for its rare earth feed sources at this time, does not currently own an operating monazite-bearing mine, and says there is no guarantee it can secure adequate monazite supply or sell separated NdPr and rare earth oxides on satisfactory terms. That matters because the mill campaigns and planned circuit expansions depend on enough feed to keep the plant running profitably. In my view, these risks do threaten the moat, but they threaten the economics around White Mesa more than the existence of White Mesa itself.
Management Discussion & Analysis
Management is trying to respond to those risks by funding the buildout and broadening the feedstock base, but the financing mix shows how capital intensive the strategy remains. The company closed $700M of 0.75% convertible senior notes due 2031 and paired that with a $53.55 million capped call purchase, which lowers cash interest and delays dilution, yet does not make the business less capital hungry. It also used its prior $150M at-the-market capacity and then raised another $272.2M of net proceeds from 40.6 million shares in 2025, so this is more a financing mix shift than a true balance-sheet strengthening.
The operating guide points in the same direction. Management is guiding to 2.0 million to 2.5 million pounds of mined uranium, 1.5 million to 2.5 million pounds processed, and 1.5 million to 2.0 million pounds sold in 2026, which signals a larger uranium contribution than 2025. At the same time, the expected Q1 2027 restart of the conventional mill run suggests a deliberate pause after the current campaign rather than a straight-line ramp. I read that as management actively trying to offset the feedstock and utilization risk, but the company still has to prove that the higher-volume plan can translate into cash.
Recent Events
The most important recent development is the March 2026 CEO succession plan. Mark Chalmers will retire on April 15, 2026 and Ross Bhappu will take over as president and chief executive officer, while Chalmers stays on as a consultant for two years. I see that as continuity rather than disruption, which matters because the company is still executing a multi-asset buildout.
The March 2026 amendment to the Australian Strategic Materials transaction is also meaningful. Energy Fuels replaced ASM’s planned special dividend with A$0.13 of cash consideration and kept the rest of the deal terms unchanged. That keeps the acquisition structure intact, which supports the rare earth and mineral sands strategy, but it also leaves closing risk in place because the transaction still depends on shareholder, court, and regulatory approvals.
A later legal and government-relations reshuffle reinforces the same theme. David Frydenlund moved into strategic acquisitions and financings, and Nathan Longenecker became chief legal officer and executive vice president, global government relations. I read that as a sign that management is still building the legal and transactional bench needed for a more complex platform.
Financial Analysis
Growth
UUUU — Financial Growth (Quarterly, USD Mil)
| Metric | 2025-06-30 | 2025-09-30 | 2025-12-31 | 2026-03-31 | 2026-06-30 | 2026-09-30 |
|---|---|---|---|---|---|---|
| REVENUE (USD Mil) | — | 17.7 | 27.1 | 35.8 | 25.1 | 29.2 |
| EBIT (USD Mil) | — | -16.9 | -22.1 | -14.5 | -31.2 | -50.3 |
| EBITDA (USD Mil) | — | -15.5 | -20.7 | -13.1 | -29.6 | -48.1 |
| NET INCOME (USD Mil) | — | -16.7 | -20.8 | -10.8 | -33.4 | -52.2 |
| DILUTED EPS | -0.1 | -0.1 | — | 0 | -0.1 | -0.2 |
Source: Yahoo Finance — Quarterly Financial Statements
Revenue rose from $17.7M in Q3 2025 to $35.8M in Q1 2026, then eased to $25.1M in Q2 2026 and $29.2M in Q3 2026. That pattern is volatile rather than steadily compounding, even though the Q1 2026 print was materially stronger than the prior-year quarter. EBITDA moved from -$15.5M in Q3 2025 to -$13.1M in Q1 2026, but then worsened to -$29.6M in Q2 2026 and -$48.1M in Q3 2026, so earnings are deteriorating faster than revenue.
The growth profile is therefore not yet self-sustaining. I think that matters because a higher revenue base should be helping fixed costs absorb better by now, but the recent quarters show the opposite.
Growth versus peers
| Company | Revenue TTM (USD Mil) | Revenue Growth YoY % | EBITDA TTM (USD Mil) | Diluted EPS TTM |
|---|---|---|---|---|
| UUUU | 117.2 | 64.8% | -60.6 | -0.5 |
| UEC | 37.2 | — | -126.2 | -0.3 |
| LEU | 454.5 | -25.9% | -2.8 | 3.4 |
| DNN | 4.1 | 0.1% | -59.2 | 0 |
| ET | 124,528 | 85.9% | 17,941 | 1.5 |
Source: Yahoo Finance
UUUU’s revenue growth of 64.8% TTM is the strongest in the uranium group, but it is coming from a much smaller base and with EBITDA of -$60.6M. LEU is down 25.9% TTM, DNN is essentially flat at 0.1%, and ET is growing 85.9% on a vastly larger revenue base, so UUUU’s top-line momentum is real but not yet matched by earnings power.
Profitability
UUUU — Profitability (TTM)
| Metric | TTM |
|---|---|
| Operating Margin (TTM) | -62.1% |
| Net Margin (TTM) | -100.0% |
| Return on Assets (TTM) | -3.7% |
| Return on Equity (TTM) | -14.1% |
Source: Yahoo Finance — Trailing Twelve Months (TTM)
TTM operating margin was -62.1%, net margin was -100%, return on assets was -3.66%, and return on equity was -14.1%. The gap between operating and net margin is extreme, which tells me below-the-line items are still overwhelming the core business. Gross margin and EBITDA margin are not disclosed in the table, so the cleanest read is that the company is still in a buildout phase rather than a mature earnings phase.
The return profile is still weak enough that leverage is amplifying the problem rather than solving it. In my view, the first threshold that matters is a positive operating margin, because that would show the business is covering its own operating cost base before the bottom line can follow.
Profitability versus peers
| Company | Operating Margin (TTM) | Net Margin (TTM) | Return on Assets (TTM) | Return on Equity (TTM) |
|---|---|---|---|---|
| UUUU | -62.1% | -100.0% | -3.7% | -14.1% |
| UEC | -357.4% | 0.0% | -6.4% | -11.6% |
| LEU | -2.8% | 16.8% | -0.3% | 10.4% |
| DNN | -2,083.5% | 0.0% | -4.7% | -15.2% |
| ET | 9.4% | 4.4% | 5.2% | 15.6% |
Source: Yahoo Finance
UUUU’s operating margin of -62.1% is better than UEC’s -357.4% and DNN’s -2,083.5%, but it is still far below ET’s 9.4% and LEU’s -2.8%. Net margin is -100.0%, which is worse than every peer except DNN’s 0.0%, and ROE of -14.1% and ROA of -3.66% show that capital is still not earning an acceptable return. The gap to peers is not just a timing issue; it is a reminder that the business still has to prove it can convert volume into durable profitability.
Valuation
UUUU — Valuation Multiples
| Metric | Value |
|---|---|
| Current Share Price (USD) | 5.9 |
| Market Cap (USD Mil) | 1,571 |
| Enterprise Value (USD Mil) | 1,396 |
| Forward P/E | 13.4 |
| Price/Sales (TTM) | 12.7 |
| Price/Book (mrq) | 1.7 |
| EV/Revenue | 12.2 |
| Beta (5Y Monthly) | 1.93 |
| Forward EPS (USD) | 0.5 |
| Analyst Target Price – Low (USD) | 14 |
| Analyst Target Price – Mean (USD) | 18.9 |
| Analyst Target Price – High (USD) | 22.5 |
| # Analyst Opinions | 4 |
Source: Yahoo Finance
Energy Fuels trades at $5.93 per share, with a market cap of $1,571 and enterprise value of $1,396. The stock sits at 12.7x price/sales and 12.2x EV/revenue, while forward P/E is 13.4x on forward EPS of $0.485. That is not a distressed valuation for a business still posting negative TTM operating cash flow, so the market is clearly paying for a recovery path rather than current cash generation.
The analyst range is $14 to $22.5 across 4 opinions, with a mean of $18.9. My own fair-value range is lower than that consensus, because I weight the negative cash flow and the uneven quarterly operating trend more heavily than the market appears to. On the analysis here, I would put fair value in a range of roughly $8 to $14 per share, which sits below the consensus mean but still above the current price. That tells me the stock is not obviously cheap, even if it is not priced for perfection either.
On an earnings basis, forward EPS of $0.485 implies a modest profit profile, but that still looks rich relative to the current cash burn and the peer set’s more established operators. The market is paying for a future step-up in earnings quality, not for today’s earnings stream.
Valuation versus peers
| Company | Current Share Price (USD) | Trailing P/E | Forward P/E | EV/Revenue | EV/EBITDA | Price/Sales (TTM) | Price/Book (mrq) | Market Cap (USD Mil) | Enterprise Value (USD Mil) | Beta (5Y Monthly) | Forward EPS | Analyst Target Price – Low | Analyst Target Price – Mean | Analyst Target Price – High | # Analyst Opinions |
|---|---|---|---|---|---|---|---|---|---|---|---|---|---|---|---|
| UUUU | 5.9 | — | 13.4 | 12.2 | — | 12.7 | 1.7 | 1,571 | 1,396 | 1.93 | 0.5 | 14 | 18.9 | 22.5 | 4 |
| UEC | 6.1 | — | — | 68.3 | — | 79.7 | 2.2 | 3,008 | 2,513 | 1.37 | -0.1 | 10 | 15.8 | 26.8 | 11 |
| LEU | 94.2 | 27.9 | 54.1 | 1.9 | — | 4.6 | 1.8 | 1,942 | 885 | 1.41 | 4.4 | 100 | 180 | 300 | 20 |
| DNN | 1.9 | — | — | 577.1 | — | 601.3 | 6.6 | 1,745 | 1,656 | 1.78 | 0 | 3.6 | 4.6 | 5.6 | 2 |
| ET | 19.2 | 12.7 | 11.3 | 1.1 | 7.5 | 0.5 | 1.9 | 65,923 | 135,709 | 0.60 | 1.8 | 22 | 24.7 | 28 | 23 |
Source: Yahoo Finance
UUUU trades at 12.2x EV/revenue and 12.7x price/sales, versus ET at 1.1x and 0.5x, LEU at 1.9x and 4.6x, UEC at 68.3x and 79.7x, and DNN at 577.1x and 601.3x. On a growth-adjusted basis, the market is not giving UUUU a bargain multiple for its growth rate, especially since the company still has negative operating cash flow and free cash flow. Using the peer EV/revenue range on UUUU’s $117.2M revenue gives a very wide implied enterprise value range, which reinforces my view that the stock is being priced on a recovery narrative rather than on current cash generation.
Leverage
UUUU — Leverage & Coverage (Quarterly)
| Metric | Value |
|---|---|
| Total Debt/Equity % (mrq) | 70.7 |
| Current Ratio (mrq) | 20.5 |
| Total Debt (mrq, USD Mil) | 683.2 |
| Operating Cash Flow (TTM, USD Mil) | -54.7 |
| Levered Free Cash Flow (TTM, USD Mil) | -91.7 |
Source: Yahoo Finance — Quarterly Financial Statements
Total debt was $683.2M against $855.9M of cash, and the current ratio was 20.49x, so near-term liquidity is strong. Total debt/equity was 70.66%, which is manageable in isolation, but operating cash flow was -$54.67M and levered free cash flow was -$91.66M, so the balance sheet is doing more work than the business itself.
That is why I separate liquidity from long-term financing risk. The company has time, but it does not yet have self-funding economics, and that distinction matters for a capital-intensive miner and processor.
Leverage versus peers
| Company | Total Debt/Equity % (mrq) | Current Ratio (mrq) | Total Debt (mrq, USD Mil) | Operating Cash Flow TTM (USD Mil) | Free Cash Flow TTM (USD Mil) |
|---|---|---|---|---|---|
| UUUU | 70.7 | 20.5 | 683.2 | -54.7 | -91.7 |
| UEC | 0.2 | 17.3 | 3 | -98.6 | -71.7 |
| LEU | 106.7 | 8.6 | 1,178.8 | -59.5 | -233.3 |
| DNN | 156 | 4.7 | 583 | -96 | -128 |
| ET | 141.7 | 1.2 | 70,712 | 13,569 | 3,029.8 |
Source: Yahoo Finance
UUUU’s debt/equity of 70.7% is below LEU, DNN, and ET, and its current ratio of 20.5x is the strongest in the group. That said, the company’s -$91.7M of levered free cash flow means the balance sheet is a cushion, not a competitive advantage, because the business still consumes cash while it builds scale. In that sense, the liquidity profile helps explain why the stock can survive the buildout, but it does not justify a premium multiple by itself.
Insider Activity
The insider transaction record shows net selling, with 8 open-market sales in the sample provided and no purchases. The selling is broad rather than isolated, led by Daniel Kapostasy and Dennis Higgs, which weakens insider alignment in my view. I would not overread one small window, but the direction of travel is still a bear signal.
Conclusion
I would put my rating as a Hold because the central tension is still unresolved: White Mesa is a real structural asset, but the numbers have not yet shown that it can generate durable cash flow at the scale the market is pricing in. The company has enough liquidity to keep building, and the 2026 uranium guide suggests the operating base should improve, but TTM operating cash flow of -$54.67M and levered free cash flow of -$91.66M tell me the thesis is still in the proving stage.
I would raise my rating more toward a Buy if uranium sales and mill throughput hold near the top end of management’s 2026 guide and operating cash flow turns positive, because that would show the mill is finally funding itself rather than just supporting growth. I would also want to see rare earth feedstock volumes become steadier, since that would reduce the quarter-to-quarter volatility that is still showing up in revenue and EBITDA. On the other side, I would move from Hold toward Sell if uranium pricing softens enough that the mill cannot stay profitably utilized, or if the 2027 rare earth commercialization timeline slips again, because that would push the cash burn problem further into the future without a clear offset.
My final view is still cautious. The asset base is interesting and the balance sheet buys time, but I think the market is already giving the company credit for a recovery that has not yet shown up in the cash flow line. Until that changes, I would stay at Hold.
What to Watch Next
- Quarterly operating cash flow turning positive — would support a move toward Buy.
- Uranium sales staying near the top end of the 2026 guide — would confirm mill utilization.
- Rare earth feedstock volumes becoming steadier — would reduce execution risk.
- Q1 2027 mill restart timing — a delay would weaken the thesis.
- Levered free cash flow improving from -$91.66M — would show the buildout is becoming self-funding.
What’s your take? I rated Energy Fuels (UUUU) HOLD above — but the goal here is to get this right, not just to publish an opinion. What would you add to this analysis, or which risk or catalyst do you think I’m under- or over-weighting? Tell me in the comments.
Our track record: every directional call is tracked publicly on The Scorecard, and Stocks Covered lists every company we have rated and when.
Sources
- SEC 10-K Annual Report — filed 2026-02-26
- SEC 8-K Filing (2026-05-15)
- SEC 8-K Filing (2026-04-17)
- SEC 8-K Filing (2026-03-18)
- SEC 8-K Filing (2026-03-03)
- SEC 8-K Filing (2026-02-26)
- SEC 8-K Filing (2026-01-26)
- SEC Form 4 Insider Transaction (2026-05-05)
- SEC Form 4 Insider Transaction (2026-04-16)
- SEC Form 4 Insider Transaction (2026-04-13)
- SEC 10-K Annual Report — FY2026
- SEC 10-K Annual Report — FY2025
- SEC 10-K Annual Report — FY2024
- SEC 10-K Annual Report — FY2023
- SEC 10-K Annual Report — FY2022
Data sourced from Yahoo Finance and SEC EDGAR. Not investment advice.
Leave a Comment