Expected price range
Each range is set from the stock’s recent price history and our Hold rating, using its own 1-year realised volatility (48% annualised) as the width of a ~68% statistical band, and checked against that rating so the range leans the same way as our view. Starting price $188 (close 2026-11-11). The stock traded between $119 and $239 over the last 6 months and between $94.11 and $239 over the last year. This is an illustration of where our view and normal volatility point, not a forecast, price target or investment advice; the stock can move outside it.
| Company | Nov 25 | Dec 25 | Jan 26 | Feb 26 | Mar 26 | Apr 26 | May 26 | Jun 26 | Jul 26 | Aug 26 | Sep 26 | Oct 26 | 12-Mo |
|---|---|---|---|---|---|---|---|---|---|---|---|---|---|
| NTAP | -5% | -4% | -10% | +3% | +3% | +9% | +57% | -11% | +16% | +4% | +13% | -5% | +72% |
| NTNX | -33% | +8% | -24% | -3% | -1% | +8% | +27% | -2% | +16% | +16% | +3% | -5% | -6% |
| DELL | -18% | -6% | -9% | +29% | +11% | +28% | +101% | +3% | -6% | +12% | +18% | -21% | +165% |
| HPE | -10% | +10% | -10% | -0% | +12% | +21% | +50% | +5% | +6% | +9% | +23% | -14% | +130% |
| STX | +8% | -0% | +48% | +0% | -4% | +72% | +31% | +10% | -11% | -3% | +11% | -30% | +153% |
| P | -10% | -25% | +4% | -8% | -8% | +21% | +11% | -1% | -2% | +20% | +41% | -3% | +29% |
Source: Yahoo Finance monthly adjusted close.
<a id="lf0-thesis"></a>
Quick Thesis
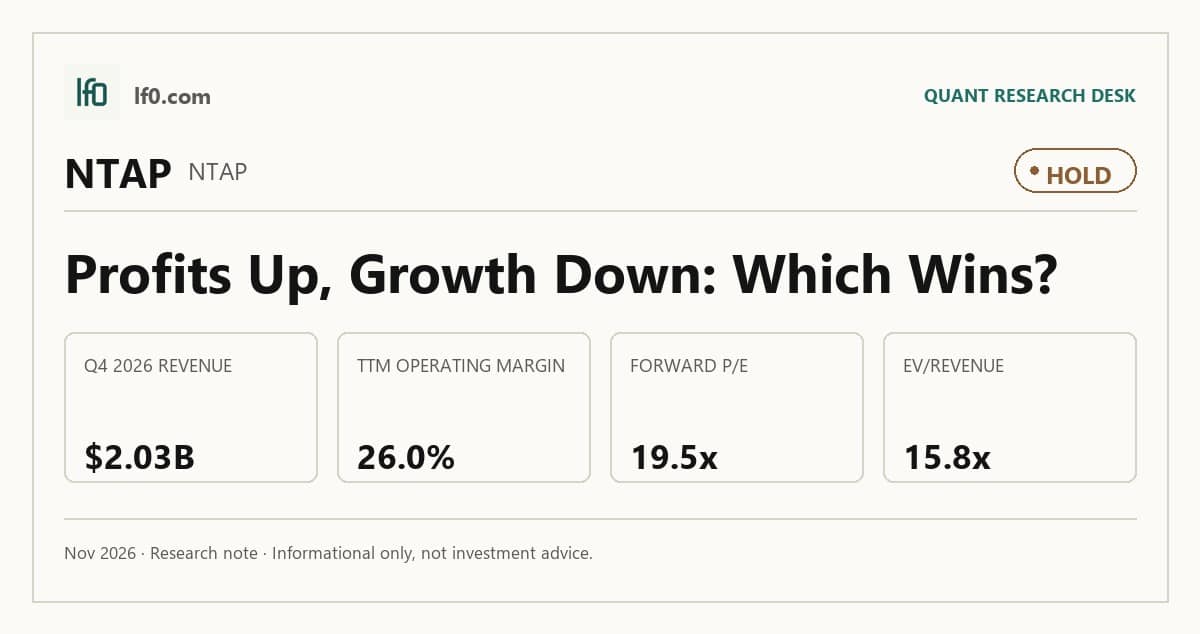
- Rated hold — valuation already discounts quality, while growth has slowed.
- Strongest point: <span class="lf0-key" data-src="Yahoo Finance — Key Statistics (Profitability): Operating Margin (TTM)">26.0%</span> TTM operating margin and <span class="lf0-key" data-src="Yahoo Finance — Key Statistics (Profitability): Net Margin (TTM)">19.2%</span> net margin.
- Main risk: revenue growth fell to <span class="lf0-key" data-src="Yahoo Finance — Quarterly Income Statement: Total Revenue (Q1 2026)">4.0%</span> in the latest quarter.
- Valuation is rich versus hardware peers at <span class="lf0-key" data-src="Yahoo Finance — Key Statistics: Forward P/E">19.5x</span> forward P/E and <span class="lf0-key" data-src="Yahoo Finance — Key Statistics: EV/Revenue">4.5x</span> EV/Revenue.
- I would turn more constructive if revenue growth re-accelerates above <span class="lf0-key" data-src="Yahoo Finance — Quarterly Income Statement: Total Revenue (Q1 2026)">15.0%</span> for two quarters.
<a id="lf0-summary"></a>
Executive Summary
Measured from adjusted close on 2026-11-11 to 2026-11-11. Sell ratings are correct when the stock falls; Hold is tracked as a +/-10% range. Daily-close data, not intraday. Calls are tracked for 182 days from publication, then frozen as a final record.
I would put my rating as a hold because NetApp’s software-led model is profitable, but the latest quarter showed only <span class="lf0-key" data-src="Yahoo Finance — Quarterly Income Statement: Total Revenue (Q1 2026)">4.0%</span> revenue growth after 21.2% in the prior quarter, and that slowdown matters more to me than the company’s still-strong margin profile. In my view, the market is already paying for durable execution at <span class="lf0-key" data-src="Yahoo Finance — Key Statistics: Forward P/E">19.5x</span> forward P/E and <span class="lf0-key" data-src="Yahoo Finance — Key Statistics: EV/Revenue">4.5x</span> EV/Revenue, so the stock needs cleaner top-line momentum to justify a higher rating.
I would raise my rating more towards a buy if revenue growth re-accelerates above <span class="lf0-key" data-src="Yahoo Finance — Quarterly Income Statement: Total Revenue (Q1 2026)">15.0%</span> year over year for two consecutive quarters, because that would tell me the latest slowdown was temporary rather than the start of a flatter demand phase. If operating margin also stays above 25.0% while free cash flow remains above $1.1B over the next twelve months, the earnings power would start to support a meaningfully higher multiple.
<a id="lf0-business"></a>
Company Profile
NetApp, Inc. sells storage systems, data management software, cloud storage, and support services to enterprises. Revenue comes from two segments: Hybrid Cloud, which includes ONTAP data management software, all-flash and hybrid-flash systems, and related services, and Public Cloud, which includes managed storage and data services on AWS, Microsoft Azure, and Google Cloud.
Founded in 1992 and listed on Nasdaq in 1995, the company has evolved from a storage hardware vendor into a software-led infrastructure platform. It is headquartered in San Jose, California, operates in more than 20 countries, and had about 11,700 employees and roughly 5,000 sales and support staff as of April 2026.
Economic Moat
Business Model
ONTAP is the core of NetApp’s moat in my view because it sits underneath storage, protection, mobility, and AI pipeline tools and is already integrated with AWS, Microsoft Azure, and Google Cloud. That gives customers one control plane for file, block, object, backup, ransomware protection, and cloud migration, which makes switching costly once an enterprise standardizes on the platform.
I also see a secondary advantage in the company’s installed base and partner ecosystem. NetApp sells through direct and channel routes and has more than 2,000 U.S. patents, but the cloud integration layer is the harder asset to copy quickly.
Business & Operating Risks
The main disclosed risk is that NetApp operates in a market being reshaped by generative AI, flash storage, hybrid cloud, and cloud storage, and management warns that it could be hurt if it fails to keep pace with those shifts. I view that as a direct test of the moat rather than a generic industry risk: if customers move workloads faster than NetApp adapts, the ONTAP advantage becomes less valuable.
Channel dependence is the second risk that matters. Most sales are made or fulfilled through resellers, systems integrators, distributors, OEMs, and cloud partners, so a partner pullback would hit revenue quickly rather than gradually.
Supply chain and component cost pressure is the third risk, especially because the company depends on a limited number of suppliers for drives and other components. The filing says inflationary pressure and supply constraints began in the second half of fiscal 2026, and that is the clearest threat to the managed-cost advantage I associate with the platform.
The disclosed risks do not break the moat, but they do pressure the parts of the model that make ONTAP valuable: partner reach, cloud integration, and margin discipline.
Management Discussion & Analysis
Management is responding to those risks, but not in a way that makes them disappear. The company is still investing in AI-related products, cloud services, and pricing actions, while also using buybacks to return cash, so the response is to defend the model rather than to retreat from it.
That said, the operating mix still shows some strain. Revenue rose 5% to $6.9B in fiscal 2026 and operating margin improved to 24%, yet gross margin only edged from 70% to 71% while product cost rose to 44% of product revenue from 42%, which tells me pricing is helping but has not fully offset component inflation.
Management’s capital allocation is also consistent with confidence in the cash engine. It repurchased $950M of stock in fiscal 2026, authorized another $1B on May 21, 2026, and still paid dividends and repaid debt, so the company is not behaving like a business under balance-sheet stress.
Recent Events
The most important recent event was the May 21, 2026 authorization of an additional $1B share repurchase program, disclosed in the May 28, 2026 8-K. I read that as a signal that management believes free cash flow is durable enough to fund capital returns without weakening the strategic position.
The board also expanded from nine to ten directors and appointed Paul Fipps on January 8, 2026, which modestly strengthens governance. The February 26, 2026 earnings filing kept the operating cadence current, but it did not change the strategic picture.
Taken together, the recent filings reinforce the moat thesis at the margin: NetApp is still investing in the platform, but it is also confident enough in cash generation to keep buying back stock.
Financial Analysis
<a id="lf0-growth"></a>
Growth
NTAP — Financial Growth (Quarterly, USD Mil)
| Metric | 2025-07-31 | 2025-10-31 | 2026-01-31 | 2026-04-30 | 2026-07-31 |
|---|---|---|---|---|---|
| REVENUE (USD Mil) | 1,559 | 1,705 | 1,713 | 1,948 | 2,025 |
| EBIT (USD Mil) | 333 | 419 | 459 | 546 | 513 |
| EBITDA (USD Mil) | 384 | 471 | 507 | 595 | 546 |
| NET INCOME (USD Mil) | 233 | 305 | 334 | 404 | 375 |
| DILUTED EPS | 1.1 | 1.5 | 1.7 | 2 | 1.9 |
Source: Yahoo Finance — Quarterly Financial Statements
Revenue rose from $1.6B to $2B across the five reported quarters in the table, and the latest quarter reached $2B after $1.9B in the prior period. The more important point for me is that growth slowed to <span class="lf0-key" data-src="Yahoo Finance — Quarterly Income Statement: Total Revenue (Q1 2026)">4.0%</span> in the latest quarter after 21.2% in the prior one, so the business is still growing but no longer accelerating.
EBITDA moved from 384M to 546M over the same span, while net income reached 375M in the latest quarter after peaking at 404M in the prior period. That tells me the model still converts revenue into earnings well, but the latest quarter did not extend the earlier acceleration.
Growth versus peers
| Company | Revenue TTM (USD Mil) | Revenue Growth YoY % | EBITDA TTM (USD Mil) | Diluted EPS TTM |
|---|---|---|---|---|
| <span class="lf0-primary">NTAP</span> | 7,391 | 29.9% | 2,095 | 7.1 |
| NTNX | 2,853.5 | 15.9% | 371.8 | 5.2 |
| DELL | 151,197 | 57.7% | 17,726 | 17.2 |
| HPE | 41,871 | 33.7% | 6,890 | 1.9 |
| STX | 13,799 | 61.0% | 5,867 | 19.1 |
| P | 4,262.1 | 37.7% | 384.1 | 0.7 |
Source: Yahoo Finance
NTAP’s 29.9% revenue growth TTM sits below STX at 61.0% and DELL at 57.7%, but above NTNX at 15.9% and P at 37.7%. That tells me NetApp is not the fastest grower in the group, so the case for the stock has to rest on quality of earnings and cash flow rather than top-line leadership.
<a id="lf0-profitability"></a>
Profitability
TTM operating margin was <span class="lf0-key" data-src="Yahoo Finance — Key Statistics (Profitability): Operating Margin (TTM)">26.0%</span>, net margin was <span class="lf0-key" data-src="Yahoo Finance — Key Statistics (Profitability): Net Margin (TTM)">19.2%</span>, return on assets was 11.7%, and return on equity was 114.8%. I care most about the operating and net margin pair because they show the core business is already highly profitable, not still in a cash-burn phase.
The ROE figure is inflated by a thin equity base, so I weight ROA and operating margin more heavily. On that basis, the profitability profile supports the moat thesis: NetApp is earning strong returns without needing the extreme leverage profile that distorts some peers.
Profitability versus peers
| Company | Operating Margin (TTM) | Net Margin (TTM) | Return on Assets (TTM) | Return on Equity (TTM) |
|---|---|---|---|---|
| <span class="lf0-primary">NTAP</span> | 26.0% | 19.2% | 11.7% | 114.8% |
| NTNX | 10.6% | 52.8% | 4.5% | 37,460.2% |
| DELL | 9.9% | 7.5% | 8.6% | — |
| HPE | 8.1% | 6.7% | 2.6% | 10.9% |
| STX | 40.5% | 31.9% | 37.2% | 259.4% |
| P | 5.3% | 5.9% | 3.0% | 17.7% |
Source: Yahoo Finance
NTAP’s <span class="lf0-key" data-src="Yahoo Finance — Key Statistics (Profitability): Operating Margin (TTM)">26.0%</span> operating margin and <span class="lf0-key" data-src="Yahoo Finance — Key Statistics (Profitability): Net Margin (TTM)">19.2%</span> net margin are well above DELL’s 9.9% and 7.5%, HPE’s 8.1% and 6.7%, and P’s 5.3% and 5.9%. That margin advantage is the main reason I think NetApp deserves a premium to the lower-quality hardware names.
ROA at 11.7% also compares favorably with HPE at 2.6% and P at 3.0%, while NTNX’s 52.8% net margin is distorted by accounting effects rather than a cleaner operating model. The margin profile therefore supports the valuation, but only if growth stabilizes.
<a id="lf0-valuation"></a>
Valuation
NetApp trades at <span class="lf0-key" data-src="Yahoo Finance — Key Statistics: EV/Revenue">4.5x</span> EV/Revenue, 15.8x EV/EBITDA, 24.9x trailing P/E, and <span class="lf0-key" data-src="Yahoo Finance — Key Statistics: Forward P/E">19.5x</span> forward P/E on a $189 share price. That is not cheap for a storage company, especially when the latest quarter’s growth slowed to <span class="lf0-key" data-src="Yahoo Finance — Quarterly Income Statement: Total Revenue (Q1 2026)">4.0%</span>, so the multiple already assumes that execution stays clean.
On the analysis here, I would put fair value in a range of about $170-$215 per share. That sits broadly inside the analyst target range of $170-$300, but below the $212 consensus mean because I give more weight to the recent growth deceleration and the fact that the stock already trades at a premium to hardware peers on revenue and earnings multiples.
I would also frame the earnings power as roughly $10.5-$11.5 of forward EPS, which is close to the company’s 11.2 forward EPS estimate and implies the market is paying for steady compounding rather than a step-change in earnings. Against peers, that looks rich on a growth-adjusted basis versus DELL and HPE, while still cheaper than the more expensive names in the group.
The stock is not expensive enough to call a sell, but it is priced for continued margin discipline and a re-acceleration in demand. That is why I keep the rating at hold rather than leaning into the premium multiple.
Valuation versus peers
| Company | Current Share Price (USD) | Trailing P/E | Forward P/E | EV/Revenue | EV/EBITDA | Price/Sales (TTM) | Price/Book (mrq) | Market Cap (USD Mil) | Enterprise Value (USD Mil) | Beta (5Y Monthly) | Forward EPS | Analyst Target Price – Low | Analyst Target Price – Mean | Analyst Target Price – High | # Analyst Opinions |
|---|---|---|---|---|---|---|---|---|---|---|---|---|---|---|---|
| <span class="lf0-primary">NTAP</span> | 188.6 | 24.9 | 19.5 | 4.5 | 15.8 | 4.8 | 23.1 | 34,570 | 33,528 | 1.51 | 11.2 | 170 | 211.7 | 300 | 16 |
| NTNX | 60.9 | 11.5 | 25.5 | 5.4 | 37.4 | 6.1 | 23 | 16,173 | 15,330 | 0.71 | 2.7 | 63 | 79.3 | 100 | 15 |
| DELL | 382.4 | 20.1 | 11.5 | 1.6 | 13.5 | 1.5 | — | 212,603 | 235,500 | 1.44 | 30.3 | 490 | 590 | 700 | 25 |
| HPE | 51.8 | 24.7 | 10.5 | 1.9 | 11.5 | 1.6 | 2.4 | 63,625 | 77,653 | 1.47 | 4.7 | 62 | 72.2 | 92 | 21 |
| STX | 565.6 | 26.6 | 13.4 | 8.5 | 21.1 | 8.5 | 33.6 | 115,152 | 116,566 | 2.20 | 65.3 | 700 | 1,044.8 | 1,588 | 24 |
| P | 111.5 | 139.7 | 23.5 | 7.8 | 75.4 | 8.3 | 22.1 | 33,983 | 33,200 | 1.45 | 4.2 | 80 | 151.1 | 215 | 19 |
Source: Yahoo Finance
NTAP trades at <span class="lf0-key" data-src="Yahoo Finance — Key Statistics: EV/Revenue">4.5x</span> EV/Revenue, 15.8x EV/EBITDA, 24.9x trailing P/E, and <span class="lf0-key" data-src="Yahoo Finance — Key Statistics: Forward P/E">19.5x</span> forward P/E, versus DELL at 1.6x, 13.5x, 20.1x, and 11.5x, HPE at 1.9x, 11.5x, 24.7x, and 10.5x, STX at 8.5x, 21.1x, 26.6x, and 13.4x, and P at 7.8x, 75.4x, 139.7x, and 23.5x. On that basis, NetApp looks expensive versus DELL and HPE but cheaper than STX and P, which is consistent with a business that is better than a plain hardware name but not the fastest grower in the set.
The stock’s 58.8% one-year total return also matters here: investors have already rewarded the name, so the current multiple reflects a rerating rather than a hidden bargain. In my view, the market is paying for steadier earnings quality, not for the highest growth rate in the peer group.
<a id="lf0-leverage"></a>
Leverage
Total debt/equity was 169.5%, total debt was $2.5B, and the current ratio was 1.24, so the balance sheet is not fragile but it does not give much room for error. I do not read that as distress, but I also do not read it as a clean cushion.
Operating cash flow was $1.9B TTM and levered free cash flow was $1.2B TTM, which is enough to support buybacks, dividends, and debt service. The key link for me is that cash generation is strong enough to keep leverage manageable, but not so strong that the stock can ignore a slowdown in growth.
Leverage versus peers
| Company | Total Debt/Equity % (mrq) | Current Ratio (mrq) | Total Debt (mrq, USD Mil) | Operating Cash Flow TTM (USD Mil) | Free Cash Flow TTM (USD Mil) |
|---|---|---|---|---|---|
| <span class="lf0-primary">NTAP</span> | 169.5 | 1.2 | 2,534 | 1,897 | 1,171.4 |
| NTNX | 216.6 | 1.8 | 1,521.5 | 916.7 | 727.7 |
| DELL | — | 1 | 35,284 | 12,152 | 6,033.4 |
| HPE | 76.5 | 1.1 | 20,321 | 6,694 | 4,738.6 |
| STX | 77.4 | 1.8 | 2,672 | 4,832 | 2,296.8 |
| P | 14.6 | 1.5 | 225.3 | 427.8 | -114.3 |
Source: Yahoo Finance
NTAP’s debt/equity of 169.5% is heavier than HPE’s 76.5% and STX’s 77.4%, but its current ratio of 1.24 and $1.2B of levered free cash flow show that the balance sheet is serviceable. I think that combination explains part of the valuation premium versus lower-leverage peers: investors are paying for cash generation and balance-sheet flexibility, not just for the business itself.
Compared with NTNX’s 216.6% debt/equity, NetApp is less aggressive, and that relative conservatism helps support the stock’s steadier profile. Even so, leverage is not low enough to make execution risk irrelevant.
<a id="lf0-insiders"></a>
Insider Activity
The insider transaction record is net selling, with 46 open-market sales versus 3 open-market purchases over the period shown. That matters more because insider ownership is only 0.3%, so there is little insider alignment to offset the selling.
I do not treat insider sales as a thesis breaker on their own, but I do see them as a mild negative when the stock is already priced for solid execution. The pattern does not suggest insiders are leaning into the shares at current levels.
<a id="lf0-conclusion"></a>
Conclusion
I would put my rating as a hold because the key tension is between a profitable, software-led model and a growth rate that has already slowed to <span class="lf0-key" data-src="Yahoo Finance — Quarterly Income Statement: Total Revenue (Q1 2026)">4.0%</span> in the latest quarter. The moat is real, but the market is also paying <span class="lf0-key" data-src="Yahoo Finance — Key Statistics: Forward P/E">19.5x</span> forward P/E and <span class="lf0-key" data-src="Yahoo Finance — Key Statistics: EV/Revenue">4.5x</span> EV/Revenue for that moat, so I need to see growth re-accelerate before I get more constructive.
I would raise my rating more towards a buy if revenue growth gets back above <span class="lf0-key" data-src="Yahoo Finance — Quarterly Income Statement: Total Revenue (Q1 2026)">15.0%</span> year over year for two consecutive quarters and operating margin stays above 25.0%, because that would tell me the slowdown was temporary and that the company is still converting growth into earnings at a premium level. If free cash flow also stays above $1.1B over the next twelve months, the valuation would start to look too conservative for the earnings power on offer.
I would move from hold to sell if revenue growth stays below 10.0% for two more quarters, because that would suggest the deceleration is structural rather than timing noise. I would also get more cautious if margin pressure from component inflation pushes operating margin back toward the low 20s, since that would weaken the case for paying a premium multiple.
For now, I think the bear case is slightly more likely to show up first because the latest quarter already broke the prior acceleration pattern while the valuation still assumes steady execution. NetApp is good enough to own, but I would wait for another quarter of cleaner re-acceleration before moving more constructive.
What to Watch Next
- Revenue growth above <span class="lf0-key" data-src="Yahoo Finance — Quarterly Income Statement: Total Revenue (Q1 2026)">15.0%</span> for two straight quarters — would support a move toward Buy.
- Operating margin staying above 25.0% — would confirm earnings quality is holding.
- Free cash flow above $1.1B over the next twelve months — would support a higher multiple.
- Revenue growth below 10.0% for two more quarters — would push the rating toward Sell.
- Operating margin drifting back toward the low 20s — would weaken the premium valuation case.
What’s your take? I rated NetApp (NTAP) HOLD above — but the goal here is to get this right, not just to publish an opinion. What would you add to this analysis, or which risk or catalyst do you think I’m under- or over-weighting? Tell me in the comments.
Our track record: every directional call is tracked publicly on The Scorecard, and Stocks Covered lists every company we have rated and when.
Sources
- SEC 10-K Annual Report — filed 2026-06-05
- SEC 8-K Filing (2026-05-28)
- SEC 8-K Filing (2026-02-26)
- SEC 8-K Filing (2026-01-12)
- SEC Form 4 Insider Transaction (2026-06-05)
- SEC Form 4 Insider Transaction (2026-06-03)
- SEC Form 4 Insider Transaction (2026-05-20)
- SEC 10-K Annual Report — FY2026
- SEC 10-K Annual Report — FY2024
- SEC 10-K Annual Report — FY2023
- SEC 10-K Annual Report — FY2022
- SEC 10-K Annual Report — FY2021
Data sourced from Yahoo Finance and SEC EDGAR. Not investment advice.
Leave a Comment