Expected price range
Each range is set from the stock’s recent price history and our Hold rating, using its own 1-year realised volatility (55% annualised) as the width of a ~68% statistical band, and checked against that rating so the range leans the same way as our view. Starting price $119 (close 2026-11-09). The stock traded between $49.57 and $119 over the last 6 months and between $49.57 and $119 over the last year. This is an illustration of where our view and normal volatility point, not a forecast, price target or investment advice; the stock can move outside it.
| Company | Nov 25 | Dec 25 | Jan 26 | Feb 26 | Mar 26 | Apr 26 | May 26 | Jun 26 | Jul 26 | Aug 26 | Sep 26 | Oct 26 | 12-Mo |
|---|---|---|---|---|---|---|---|---|---|---|---|---|---|
| ELF | -38% | -0% | +12% | +8% | -34% | +6% | -12% | +32% | +12% | +32% | -7% | +11% | -9% |
| EL | -2% | +11% | +10% | -5% | -34% | +7% | +16% | -11% | +6% | +22% | -9% | +18% | +15% |
| COTY | -16% | -7% | +3% | -21% | -20% | +22% | -13% | +1% | +27% | +4% | -8% | +30% | -14% |
| IPAR | -9% | +5% | +15% | +3% | -9% | +0% | +3% | +19% | +11% | -6% | -5% | +5% | +35% |
| PG | -1% | -3% | +7% | +10% | -14% | +3% | -2% | +2% | -1% | +0% | +0% | +12% | +11% |
Source: Yahoo Finance monthly adjusted close.
<a id="lf0-thesis"></a>
Quick Thesis
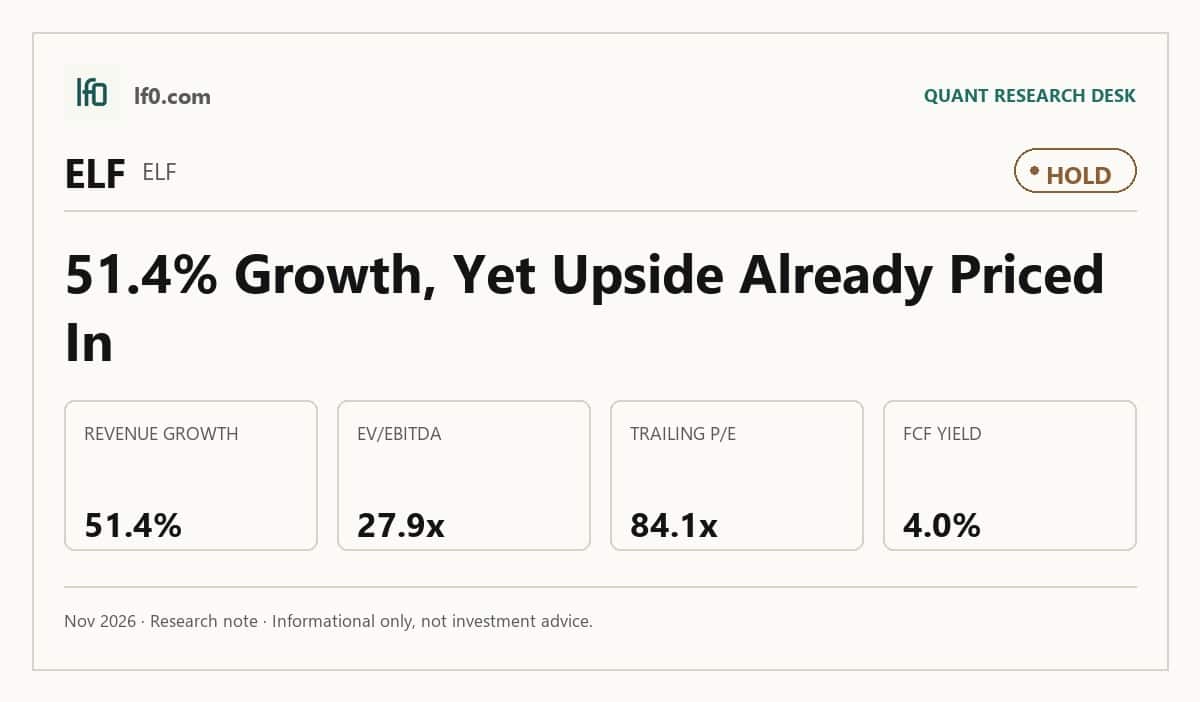
- Rated Hold — strong growth, but valuation already discounts it.
- Biggest strength: <span class="lf0-key" data-src="Yahoo Finance — Key Statistics: Quarterly Earnings Growth (yoy)">51.4%</span> TTM revenue growth and <span class="lf0-key" data-src="Yahoo Finance — Key Statistics: FCF Margin % (TTM)">14.4%</span> FCF margin.
- Biggest risk: <span class="lf0-key" data-src="Yahoo Finance — Key Statistics: EV/EBITDA">27.9x</span> EV/EBITDA leaves little room for a margin slip.
- Peer valuation is rich versus growth-adjusted cash generation.
- I would raise my rating if quarterly operating margin stays above <span class="lf0-key" data-src="Yahoo Finance — Key Statistics: Operating Margin (TTM)">13.2%</span> while revenue holds above <span class="lf0-key" data-src="Yahoo Finance — Quarterly Income Statement: Total Revenue (Q2 2026)">$450M</span>.
<a id="lf0-summary"></a>
Executive Summary
Measured from adjusted close on 2026-11-09 to 2026-11-09. Sell ratings are correct when the stock falls; Hold is tracked as a +/-10% range. Daily-close data, not intraday. Calls are tracked for 182 days from publication, then frozen as a final record.
I would put my rating as a Hold because e.l.f. Beauty is still growing fast, but the market is already paying for that growth at <span class="lf0-key" data-src="Yahoo Finance — Key Statistics: EV/EBITDA">27.9x</span> EV/EBITDA and 28.6x forward P/E. In my view, the key question is not whether the brand is working — it is whether the company can keep converting that growth into margin after the tariff shock in Q1 2026. I would become more constructive if quarterly operating margin moves back above <span class="lf0-key" data-src="Yahoo Finance — Key Statistics: Operating Margin (TTM)">13.2%</span> while revenue stays above <span class="lf0-key" data-src="Yahoo Finance — Quarterly Income Statement: Total Revenue (Q2 2026)">$450M</span>, because that would show the rhode and Naturium mix is adding earnings power, not just top-line scale.
<a id="lf0-business"></a>
Company Profile
e.l.f. Beauty is a multi-brand beauty company that sells cosmetics and skin care through e.l.f. Cosmetics, e.l.f. SKIN, rhode, Naturium, and Well People. It earns revenue through an omni-channel mix of U.S. mass, drug, food, dollar, and specialty retailers, plus direct e-commerce and international retail; 76% of FY2026 net sales came from retailers and 24% from e-commerce. The company was formed in Delaware in 2013 as J.A. Cosmetics Holdings, changed its name to e.l.f. Beauty in 2016, and completed its IPO in September 2016. Its common stock trades on the New York Stock Exchange under ELF.
The business operates globally from Oakland, California, with 849 full-time employees as of March 31, 2026. The U.S. generated 79% of FY2026 net sales, while the United Kingdom, Canada, and Germany made up the main international markets. e.l.f. relies on third-party manufacturers, primarily in China, and third-party logistics centers in the U.S. and abroad.
Economic Moat
Business Model
The core advantage is a digitally native brand paired with a productivity-led shelf model. e.l.f. can use its direct-to-consumer site, Beauty Squad loyalty data, and annual assortment resets to keep turning shelf space into faster-moving inventory than I feel a well-funded rival could copy quickly. According to their SEC filings, e.l.f. Cosmetics is the only top five mass cosmetics brand with its own direct-to-consumer e-commerce site, and the company says it is among the most productive mass cosmetics brands on a dollar-per-linear-foot basis with its largest retail customers globally.
That advantage is broader than one brand. The portfolio now spans e.l.f. Cosmetics, e.l.f. SKIN, rhode, Naturium, and Well People, while the retail footprint across Target, Walmart, Amazon, and Sephora gives the company reach that smaller entrants usually lack. The moat is not just brand awareness; it is the combination of consumer data, shelf productivity, and channel access, which is why the growth and margin data later in the article matter so much.
Business & Operating Risks
The most material disclosed risk is retailer concentration and shelf-space dependence. A limited number of retailers account for a large percentage of net sales, and the company has no firm purchase contracts, so a single buyer can cut orders or reduce display space at any time. The filing is also explicit that growth depends on retailers reallocating finite shelf space from competitors, including cases where a retailer has its own brand, and that competitive pricing could force e.l.f. to lower prices and reduce profitability.
Product launch execution is the second risk. Growth depends on new products in color cosmetics and skincare, plus adjacent categories where the company has little operating experience, so a weak launch can hurt both the new item and the existing items it cannibalizes. Supplier or manufacturer delays can also slow launches, which makes the innovation engine central to the thesis rather than a side benefit.
China and trade policy remain a third pressure point. Most products are sourced and manufactured in China, those products have faced a 25% tariff since May 2019, and the company raised prices globally after additional tariffs were announced in 2025. Management may shift production outside China, but that would bring significant cost and disruption, so the tariff issue is now embedded in the operating model rather than a one-time shock.
The rhode acquisition adds a newer layer of integration and key-person risk. The 2026 filing makes clear that Hailey Bieber is essential to the rhode brand and that expected revenue growth or integration costs could prove wrong. I do not think these risks threaten the moat itself; they threaten the pace at which the moat can be monetized, because the shelf-productivity model still looks intact even as tariffs and integration costs pressure near-term earnings.
Management Discussion & Analysis
Management is clearly using rhode as the main capital allocation lever, and that is the right read on the filing. e.l.f. Beauty paid $897.5M for rhode on August 5, 2025 and funded part of it with a $600M term loan due March 3, 2030, so management is willing to add leverage to buy growth rather than wait for it organically. That choice is visible in the numbers: rhode contributed $293.5M of the $323M increase in fiscal 2026 net sales, but interest expense also rose to $35.3M from $13.8M, so the deal is lifting revenue faster than earnings.
Gross margin held at 70.7% in fiscal 2026, down only 50 basis points from 71.2% in fiscal 2025, which tells me pricing and mix are still absorbing tariff pressure. The problem is below gross profit: SG&A rose to 63% of sales from 59% because marketing, merchandising, and distribution costs increased by $129.1M. In other words, management is buying scale with heavier spending, not harvesting clean operating leverage yet.
The tariff disclosure is the biggest gap between the narrative and the earnings bridge. Management highlights the Supreme Court ruling and refund process, yet it still paid about $58.5M of IEEPA tariffs in fiscal 2026 and says it may not be able to fully mitigate future tariff costs. Cash generation remains solid, with operating cash flow of $288.2M in fiscal 2026 and $289.7M of cash at March 31, 2026, but the $50M share repurchase in fiscal 2026 was clearly secondary to acquisition funding and debt service. The company is responding to the risks, but it is doing so by leaning harder into growth and leverage rather than by removing the tariff overhang.
Management’s track record is mixed, not broken. Prior filings warned that tariff policy would keep evolving, and fiscal 2026 confirmed that view with tariff rates ranging from 25% to as high as 170% before a 10% global tariff under Section 122 in February 2026. The earlier filings also framed Naturium as a growth driver, and fiscal 2026 supported that claim because the existing business added only $29.5M of the $323M sales increase while rhode did the heavy lifting. On leadership, the current filing does not indicate a CEO or CFO change from the prior year, so there is no governance disruption to flag.
Recent Events
The most important recent event was the February 12, 2026 board appointment of Matthew Farrell, a former chief executive officer of Church & Dwight and former chief financial officer. For a brand-led beauty company, that adds consumer-products operating discipline and should help capital allocation, so I read it as a modest positive for the moat rather than a headline-changing event.
The February 4, 2026 and May 20, 2026 earnings releases were routine, but they still matter because they show management is operating through the normal reporting cadence rather than through a restructuring, financing, or strategic reset. I do not see any sign in these filings of a balance-sheet event, divestiture, or regulatory issue that would weaken the structural advantage described above. The recent filings leave the moat intact, with the board addition providing a small constructive signal.
Financial Analysis
<a id="lf0-growth"></a>
Growth
ELF — Financial Growth (Quarterly, USD Mil)
| Metric | 2025-06-30 | 2025-09-30 | 2025-12-31 | 2026-03-31 | 2026-06-30 | 2026-09-30 |
|---|---|---|---|---|---|---|
| REVENUE (USD Mil) | 353.7 | 343.9 | 489.5 | 449.3 | 479.4 | — |
| EBIT (USD Mil) | 53.7 | 5.2 | 66.2 | -43.9 | 102.1 | — |
| EBITDA (USD Mil) | 66.9 | 23.4 | 87.8 | -17.6 | 128.2 | — |
| NET INCOME (USD Mil) | 33.3 | 3 | 39.4 | -49.4 | 66.6 | — |
| DILUTED EPS | — | 0.1 | 0.7 | -0.8 | 1.1 | 0.5 |
Source: Yahoo Finance — Quarterly Financial Statements
Revenue moved from $353.7M in Q2 2025 to $343.9M in Q3 2025, then jumped to $489.5M in Q4 2025 before easing to $449.3M in Q1 2026 and $479.4M in Q2 2026. That is a lumpy path, but the direction is still positive: the business is scaling, and the volatility looks more like mix and tariff noise than a demand break. EBITDA followed the same pattern, turning negative at $17.6M in Q1 2026 before rebounding to $128M in Q2 2026, which tells me the model can recover quickly when the cost base normalizes. The growth profile is still strong enough to support the moat, but it is not smooth enough to justify ignoring execution risk.
Growth versus peers
| Company | Revenue TTM (USD Mil) | Revenue Growth YoY % | EBITDA TTM (USD Mil) | Diluted EPS TTM |
|---|---|---|---|---|
| <span class="lf0-primary">ELF</span> | 1,939 | 51.4% | 266.6 | 1.4 |
| EL | 15,283 | 6.7% | 2,600 | 1 |
| COTY | 5,784.6 | -1.4% | 778 | -0.7 |
| IPAR | 1,501.6 | -0.0% | 292.6 | 5.3 |
| PG | 87,922 | 4.0% | 25,088 | 6.6 |
Source: Yahoo Finance
ELF’s revenue grew <span class="lf0-key" data-src="Yahoo Finance — Key Statistics: Quarterly Earnings Growth (yoy)">51.4%</span> TTM, far ahead of EL at 6.7%, PG at 4.0%, IPAR at -0.0%, and COTY at -1.4%. That growth gap is real, and it is the main reason the stock deserves a premium to slower peers. The question is whether that premium is still justified once growth is measured against cash generation and leverage.
<a id="lf0-profitability"></a>
Profitability
TTM gross margin was 71.8%, EBITDA margin was 13.8%, operating margin was <span class="lf0-key" data-src="Yahoo Finance — Key Statistics: Operating Margin (TTM)">13.2%</span>, net margin was 4.47%, ROA was 5.44%, and ROE was 7.33%. The 58.6-point gap between gross margin and operating margin tells me selling, marketing, and overhead still absorb a large share of the gross profit, so investors should focus on operating leverage rather than product margin alone. Net margin sits 8.7 points below operating margin, which means interest, taxes, and other below-the-line items still matter, but the company is already profitable on a TTM basis. That is important because the moat only becomes investable if the brand engine can translate into real earnings, not just revenue growth.
Profitability versus peers
| Company | Operating Margin (TTM) | Net Margin (TTM) | Return on Assets (TTM) | Return on Equity (TTM) | Gross Margin (TTM) | EBITDA Margin (TTM) |
|---|---|---|---|---|---|---|
| <span class="lf0-primary">ELF</span> | 13.2% | 4.5% | 5.4% | 7.3% | 71.8% | 13.8% |
| EL | 11.0% | 2.4% | 5.8% | 9.3% | 76.0% | 17.0% |
| COTY | 11.6% | -9.7% | 1.7% | -14.6% | 62.6% | 13.5% |
| IPAR | 27.4% | 11.3% | 10.7% | 19.0% | 59.8% | 19.5% |
| PG | 26.9% | 18.2% | 10.5% | 29.6% | 50.6% | 28.5% |
Source: Yahoo Finance
ELF’s gross margin of 71.8% is below EL’s 76.0% but above COTY’s 62.6% and IPAR’s 59.8%, while its EBITDA margin of 13.8% trails EL’s 17.0% and IPAR’s 19.5%. That spread points to an opex gap rather than a product-margin problem, which is consistent with a brand platform still spending heavily to scale. ELF’s operating margin of <span class="lf0-key" data-src="Yahoo Finance — Key Statistics: Operating Margin (TTM)">13.2%</span> and net margin of 4.47% are also below the best peers, so the company is profitable but not yet a top-tier earnings machine.
<a id="lf0-valuation"></a>
Valuation
e.l.f. Beauty screens expensive on the multiple that matters most here: EV/Revenue is 3.84x, Price/Sales is 3.64x, EV/EBITDA is <span class="lf0-key" data-src="Yahoo Finance — Key Statistics: EV/EBITDA">27.9x</span>, and trailing P/E is 84.1x. At a share price of $119, the market is paying for a business that can keep converting revenue into EBITDA at a high rate and sustain that conversion through tariff pressure. Forward P/E falls to 28.6x on 4.17 of forward EPS, which still implies a sharp earnings rebound from the Q1 2026 loss of $0.84 per share. FCF yield is 4.0%, so the stock is not cheap on cash generation either.
On the analysis here, I would put fair value in a range of about $103–$140 per share. That sits inside the $103–$140 analyst target range from 16 opinions, which tells me the market and the sell side are broadly aligned on the idea that this is a quality growth name, even if the current price already reflects a lot of that optimism. I would not call the stock deeply mispriced; rather, I think the current quote is near the upper end of what the cash-flow and margin profile can justify unless operating margin re-accelerates.
I would also frame the earnings power as a $3.8-$4.5 forward EPS range if margins hold near current levels and revenue stays around the recent <span class="lf0-key" data-src="Yahoo Finance — Quarterly Income Statement: Total Revenue (Q2 2026)">$450M</span> quarterly run rate. That is close to the company’s 4.17 forward EPS estimate, which suggests the consensus is not wildly off, but it also means the stock is already discounting a fairly clean execution path. Relative to peers, that EPS profile is rich on growth but not cheap on cash generation, so the valuation only works if the margin recovery proves durable.
Valuation versus peers
| Company | Current Share Price (USD) | Trailing P/E | Forward P/E | EV/Revenue | EV/EBITDA | Price/Sales (TTM) | Price/Book (mrq) | Market Cap (USD Mil) | Enterprise Value (USD Mil) | Beta (5Y Monthly) | FCF Yield % (TTM) | Forward EPS | Analyst Target Price – Low | Analyst Target Price – Mean | Analyst Target Price – High | # Analyst Opinions |
|---|---|---|---|---|---|---|---|---|---|---|---|---|---|---|---|---|
| <span class="lf0-primary">ELF</span> | 119.4 | 84.1 | 28.6 | 3.8 | 27.9 | 3.6 | 5.8 | 7,060 | 7,439 | 1.58 | 4.0% | 4.2 | 103 | 129.6 | 140 | 16 |
| EL | 113.8 | 113.8 | 28 | 3 | 17.6 | 2.7 | 10.2 | 41,222 | 45,880 | 1.23 | 5.2% | 4.1 | 70 | 114.9 | 129 | 28 |
| COTY | 4.2 | — | 15.8 | 1.2 | 8.7 | 0.6 | 1.2 | 3,671 | 6,734 | 0.85 | 19.0% | 0.3 | 1.5 | 3.2 | 4 | 14 |
| IPAR | 136.5 | 25.7 | 26.6 | 3 | 15.5 | 2.9 | 5 | 4,371 | 4,537 | 1.09 | 4.8% | 5.1 | 85 | 129.7 | 156 | 6 |
| PG | 166.7 | 25.1 | 22.5 | 4.6 | 16.3 | 4.4 | 7.1 | 386,421 | 407,907 | 0.36 | 3.3% | 7.4 | 151 | 174 | 190 | 23 |
Source: Yahoo Finance
ELF trades at <span class="lf0-key" data-src="Yahoo Finance — Key Statistics: EV/EBITDA">27.9x</span> EV/EBITDA and 28.6x forward P/E, versus EL at 17.6x EV/EBITDA and 28.0x forward P/E, IPAR at 15.5x EV/EBITDA and 26.6x forward P/E, COTY at 8.7x EV/EBITDA and 15.8x forward P/E, and PG at 16.3x EV/EBITDA and 22.5x forward P/E. On a growth-adjusted basis, ELF is not cheap, but it is also not the most expensive name in the group once you factor in its <span class="lf0-key" data-src="Yahoo Finance — Key Statistics: Quarterly Earnings Growth (yoy)">51.4%</span> revenue growth and 4.0% FCF yield. The market is paying for speed, yet the valuation still assumes that speed can persist.
<a id="lf0-leverage"></a>
Leverage
Leverage is manageable, but it is not a source of upside. Total debt/equity was 75.1% in mrq, current ratio was 2.571x, and total debt was $920.3M, which gives the company enough balance-sheet room to absorb a softer quarter without immediate refinancing pressure. Operating cash flow was $288.2M in TTM and levered free cash flow was $279.6M, so cash conversion is strong and most of EBITDA is reaching cash rather than being absorbed by capex or interest. Net debt/EBITDA was 2.136x and FCF margin was 14.42%, which is solid, but not so strong that leverage alone can justify a richer multiple.
Leverage versus peers
| Company | Total Debt/Equity % (mrq) | Current Ratio (mrq) | Total Debt (mrq, USD Mil) | Operating Cash Flow TTM (USD Mil) | Free Cash Flow TTM (USD Mil) | Net Debt/EBITDA (TTM) | FCF Margin % (TTM) |
|---|---|---|---|---|---|---|---|
| <span class="lf0-primary">ELF</span> | 75.1 | 2.6 | 920.3 | 288.2 | 279.6 | 2.1 | 14.4% |
| EL | 227.8 | 1.3 | 9,200 | 1,947 | 2,137.2 | 2.3 | 14.0% |
| COTY | 86.2 | 0.8 | 3,000.1 | 603 | 697.5 | 3.6 | 12.1% |
| IPAR | 19.2 | 3.3 | 212.1 | 248.9 | 209.1 | -0.1 | 13.9% |
| PG | 70.3 | 0.7 | 38,925 | 19,915 | 12,653 | 0.9 | 14.4% |
Source: Yahoo Finance
ELF’s debt/equity of 75.1% is far below EL’s 227.8% and COTY’s 86.2%, and its net debt/EBITDA of 2.136x is slightly better than EL’s 2.3x and much better than COTY’s 3.6x. ELF’s 14.42% FCF margin is close to EL’s 14.0% and above COTY’s 12.1%, which means cash conversion is respectable. The balance sheet is not the constraint here; the constraint is whether the company can keep turning that leverage profile into enough earnings growth to justify the multiple.
<a id="lf0-insiders"></a>
Insider Activity
The insider transaction record is decisively net selling. The visible sample shows eight open-market sales, including a 41,520-share sale by the CEO on April 27, 2026, and no purchases in the transactions shown. I would not overread one filing window, but the pattern does not suggest broad insider conviction at current prices. That matters because the stock is already near its 52-week high, so insider selling reinforces the view that valuation is doing a lot of the work here.
<a id="lf0-conclusion"></a>
Conclusion
I would put my rating as a Hold because the bull case and the bear case are both visible in the numbers. The bull case is straightforward: revenue is still growing <span class="lf0-key" data-src="Yahoo Finance — Key Statistics: Quarterly Earnings Growth (yoy)">51.4%</span> TTM, gross margin remains 71.8%, and free cash flow is strong enough to support a <span class="lf0-key" data-src="Yahoo Finance — Key Statistics: FCF Margin % (TTM)">14.4%</span> FCF margin. The bear case is just as clear: EV/EBITDA is <span class="lf0-key" data-src="Yahoo Finance — Key Statistics: EV/EBITDA">27.9x</span>, forward P/E is 28.6x, and Q1 2026 showed that tariffs can still push the business into a loss quarter.
What would change my view is execution against those thresholds. I would raise my rating more toward a Buy if quarterly operating margin moves back above <span class="lf0-key" data-src="Yahoo Finance — Key Statistics: Operating Margin (TTM)">13.2%</span> while revenue stays above <span class="lf0-key" data-src="Yahoo Finance — Quarterly Income Statement: Total Revenue (Q2 2026)">$450M</span>, because that would show the rhode acquisition is adding earnings quality, not just scale. I would also want to see gross margin hold near 71.8% while the company proves it can absorb tariff pressure without giving up operating leverage. If that happens, the current multiple becomes easier to defend because the earnings base would be proving itself at a higher run rate.
I would move from Hold to Sell if revenue falls below $400M in a quarter or if operating margin slips below 10%, because either outcome would suggest the current valuation is too rich for the earnings power on offer. Another warning sign would be a fresh wave of net insider selling at the pace seen in 2026, since that would reinforce the idea that management is comfortable taking liquidity off the table while the stock still trades near its 52-week high. For now, I think the company is good enough to own, but not cheap enough to chase.
What to Watch Next
- Quarterly operating margin above <span class="lf0-key" data-src="Yahoo Finance — Key Statistics: Operating Margin (TTM)">13.2%</span> — would support a move toward Buy.
- Quarterly revenue above <span class="lf0-key" data-src="Yahoo Finance — Quarterly Income Statement: Total Revenue (Q2 2026)">$450M</span> — would confirm rhode and Naturium are still adding scale.
- Gross margin near 71.8% — would show tariff pressure is still being absorbed.
- Quarterly revenue below $400M — would raise concern that growth is slowing too fast.
- Operating margin below 10% — would argue the current multiple is too rich.
What’s your take? I rated e.l.f. Beauty (ELF) HOLD above — but the goal here is to get this right, not just to publish an opinion. What would you add to this analysis, or which risk or catalyst do you think I’m under- or over-weighting? Tell me in the comments.
Our track record: every directional call is tracked publicly on The Scorecard, and Stocks Covered lists every company we have rated and when.
Sources
- SEC 10-K Annual Report — filed 2026-05-21
- SEC 8-K Filing (2026-05-20)
- SEC 8-K Filing (2026-02-13)
- SEC 8-K Filing (2026-02-04)
- SEC Form 4 Insider Transaction (2026-06-05)
- SEC Form 4 Insider Transaction (2026-06-05)
- SEC Form 4 Insider Transaction (2026-06-05)
- SEC 10-K Annual Report — FY2026
- SEC 10-K Annual Report — FY2025
- SEC 10-K Annual Report — FY2024
- SEC 10-K Annual Report — FY2023
- SEC 10-K Annual Report — FY2022
Data sourced from Yahoo Finance and SEC EDGAR. Not investment advice.
Leave a Comment