Expected price range
Each range is set from the stock’s recent price history and our Hold rating, using its own 1-year realised volatility (80% annualised) as the width of a ~68% statistical band, and checked against that rating so the range leans the same way as our view. Starting price $31.54 (close 2026-11-09). The stock traded between $26.30 and $54.05 over the last 6 months and between $15.92 and $55.33 over the last year. This is an illustration of where our view and normal volatility point, not a forecast, price target or investment advice; the stock can move outside it.
| Company | Nov 25 | Dec 25 | Jan 26 | Feb 26 | Mar 26 | Apr 26 | May 26 | Jun 26 | Jul 26 | Aug 26 | Sep 26 | Oct 26 | 12-Mo |
|---|---|---|---|---|---|---|---|---|---|---|---|---|---|
| VIAV | +1% | -1% | +37% | +21% | +12% | +57% | -7% | -2% | -23% | -2% | +16% | -29% | +69% |
| COHR | +24% | +12% | +15% | +22% | -8% | +34% | +13% | +9% | -33% | +6% | +4% | -27% | +59% |
| LITE | +61% | +13% | +6% | +79% | +0% | +28% | -5% | +0% | -17% | +28% | +6% | -13% | +317% |
| CIEN | +8% | +15% | +8% | +38% | +11% | +36% | +10% | -15% | -23% | +2% | -8% | -9% | +69% |
| KEYS | +8% | +3% | +6% | +42% | -8% | +24% | -3% | +3% | -9% | +1% | +13% | -16% | +68% |
| EXTR | -8% | -5% | -12% | -4% | +8% | +46% | +20% | +22% | -7% | -25% | -5% | +5% | +19% |
Source: Yahoo Finance monthly adjusted close.
<a id="lf0-thesis"></a>
Quick Thesis
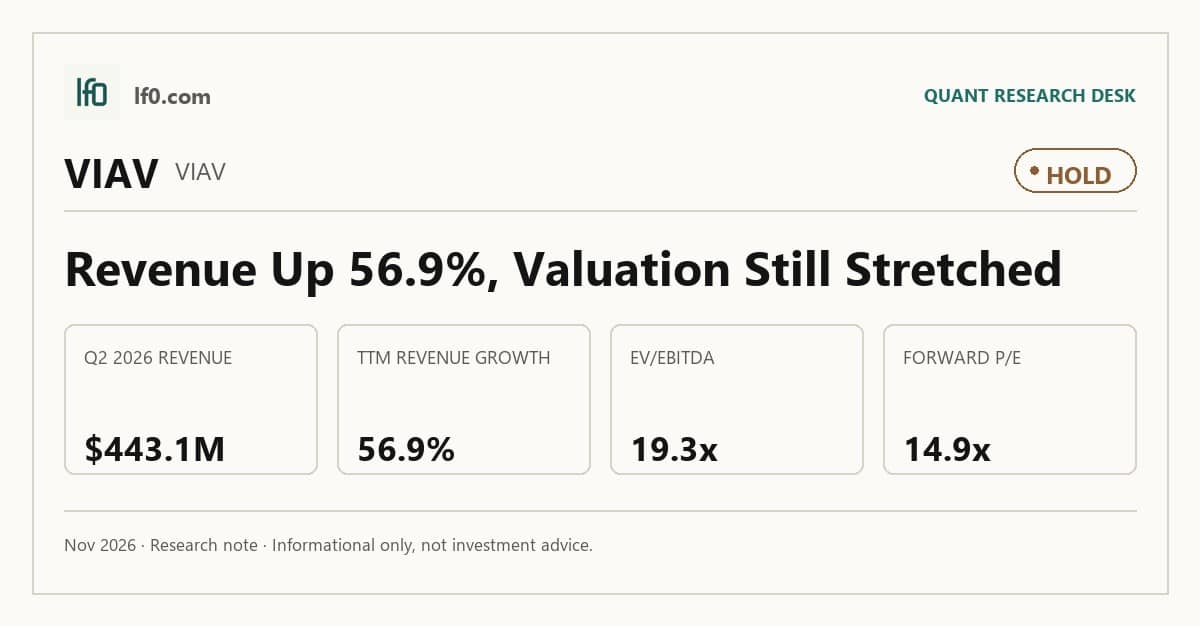
- Rated Hold — revenue growth is strong, but the market already prices in a cleaner earnings recovery.
- Revenue reached <span class="lf0-key" data-src="Yahoo Finance — Quarterly Income Statement: Total Revenue (Q2 2026)">$443.1M</span> in Q2 2026, up <span class="lf0-key" data-src="Yahoo Finance — Quarterly Income Statement: Total Revenue YoY = (443 – 290) / 290 x 100 = +52.8% (Q2 2026 vs Q2 2025)">40.8%</span> year over year.
- Main risk: customer concentration and execution, with net debt at <span class="lf0-key" data-src="Derived calculation: (Total Debt (mrq) – Total Cash (mrq)) ÷ EBITDA (TTM)">0.45x</span> EBITDA.
- Valuation is mixed: <span class="lf0-key" data-src="Yahoo Finance — Key Statistics: EV/Revenue">4.3x</span> EV/revenue and <span class="lf0-key" data-src="Yahoo Finance — Key Statistics: Forward P/E">14.9x</span> forward P/E.
- I would raise my rating if operating margin holds in the low 20s for two quarters.
<a id="lf0-summary"></a>
Executive Summary
Measured from adjusted close on 2026-11-09 to 2026-11-09. Sell ratings are correct when the stock falls; Hold is tracked as a +/-10% range. Daily-close data, not intraday. Calls are tracked for 182 days from publication, then frozen as a final record.
I would put my rating as a Hold because VIAVI’s revenue growth and cash generation are good enough to support the current price, but the stock already discounts a recovery that is not yet fully visible in the earnings base. Revenue reached <span class="lf0-key" data-src="Yahoo Finance — Quarterly Income Statement: Total Revenue (Q2 2026)">$443.1M</span> in Q2 2026, up <span class="lf0-key" data-src="Yahoo Finance — Quarterly Income Statement: Total Revenue YoY = (443 – 290) / 290 x 100 = +52.8% (Q2 2026 vs Q2 2025)">40.8%</span> year over year, while levered free cash flow was $208.2M in TTM and net debt was only <span class="lf0-key" data-src="Derived calculation: (Total Debt (mrq) – Total Cash (mrq)) ÷ EBITDA (TTM)">0.45x</span> EBITDA, so the balance sheet is not the problem; the issue is that the market is already paying for a cleaner margin profile than the company has delivered so far. I would raise my rating more towards a Buy if operating margin moved from 20.0% to the low 20s and stayed there for two quarters, because that would show the restructuring is turning into durable earnings power rather than a temporary cost reset.
<a id="lf0-business"></a>
Company Profile
VIAVI Solutions designs and sells network test, monitoring, and assurance systems for communications service providers, hyperscalers, network equipment manufacturers, original equipment manufacturers, government, and avionics customers. It also supplies light management technologies for anti-counterfeiting, 3D sensing, consumer electronics, industrial, automotive, government, and aerospace uses. Revenue comes from instruments, software, embedded systems, and services across three segments: Network Enablement, Service Enablement, and Optical Security and Performance Products. Founded in 1979, it became VIAVI after the 2015 spin-off from JDS Uniphase and is listed on Nasdaq under VIAV. The company operates manufacturing sites in China, France, Germany, Mexico, the United Kingdom, and the United States, employs about 3,600 people worldwide, and has 994 U.S. patents plus 1,969 foreign patents.
Economic Moat
Business Model
The installed base of hundreds of thousands of network test units is the hardest advantage to copy, because VIAVI’s NE segment has hundreds of thousands of units in active use worldwide and those instruments sit inside lab, field, and service workflows that are already embedded at NEMs, operators, and service providers. In my view, a well-funded competitor would struggle to rebuild that footprint within 3 years without displacing entrenched customer processes, retraining technicians, and winning qualification cycles across multiple product families. The secondary support is breadth: VIAVI also has one of the broadest portfolios of wireline and wireless products in network enablement, plus AI and machine learning features, which makes the installed base stickier because customers can standardize on one vendor across design, deployment, and maintenance. On the OSP side, the banknote franchise is another durable element, since its OVP and OVMP pigments are deployed on the banknotes of more than 100 countries and are sold through a strategic alliance with SICPA, a global banknote security partner. I feel that this is harder to replicate than a normal component business because the customer relationship, validation burden, and anti-counterfeiting credibility are all built over long cycles.
Business & Operating Risks
The most material risk is customer concentration and the related pricing pressure from a small set of telecom and cable buyers. VIAVI says it will continue to rely on a limited number of customers for a significant portion of revenues, and consolidation means those buyers can exert increased pressure on prices and other contract terms. Order reductions from any one customer can materially hurt periodic revenue, which makes this a live earnings risk rather than boilerplate. The same filing points to a strategic alliance with SICPA for OVP and OVMP banknote anti-counterfeiting products, and a material reduction in sales, or loss of the relationship, would hurt that line because VIAVI may not replace the partner quickly. The disclosed risks do not break the moat, but they do show that the installed-base advantage is only as durable as customer retention and product execution.
A second company-specific risk is the combination of rapid technology change and execution problems in new product ramps. VIAVI must deliver current and new products on time and at an acceptable cost, while the company also warns that manufacturing yields have been variable and that new product programs create considerable strain on execution capabilities and customer relations. That matters because it ties directly to margin pressure, not just growth uncertainty: cost reduction programs, outsourcing, and requalification can create delays, inventory issues, factory absorption concerns, and systems integration problems. The financial data in this article shows the issue has already affected results through margin pressure and uneven profitability, so the risk has moved from hypothetical to materialized.
Geopolitics and supply chain exposure are the third major risk, but here the filing is partly generic and partly specific. VIAVI highlights Russia, Israel and Hamas, and especially U.S.-China tensions, including China’s May 2023 controls on Micron products and a September 2023 bill that could authorize sanctions on certain Chinese entities in defense and surveillance technology. The mechanism is clear: export limits, higher input costs, and weaker demand in China could hit revenue and margins, while the company also suspended transactions in Russia effective February 2022, so at least one geopolitical risk has already materialized. The broader supply chain and inflation language is less company-specific, but the China and Russia references are concrete enough to matter.
- The company has a $300M asset-based secured credit facility entered into in December 2021, which gives it liquidity flexibility if customer timing or supply chain issues delay cash conversion.
- The filing says the impact of Huawei restrictions is not expected to be material to overall operations, which limits the downside from one named trade action.
- Net debt and covenant pressure are not highlighted in the current filing as a near-term stress point, so the balance sheet is not the main risk channel here.
Management Discussion & Analysis
Management is signaling a reset toward cost discipline rather than growth investment: the Fiscal 2024 Plan is expected to affect approximately 6% of the global workforce, with annualized gross cost savings of approximately $25M and completion by the end of fiscal 2025. That is a sensible response to weak demand, but the savings are a partial offset, not a growth engine, because fiscal 2024 revenue fell to $1B, down $105.7M or 9.6%, while non-GAAP operating margin still fell to 11.5% from 15.6% in fiscal 2023. The failed Spirent acquisition matters for capital deployment credibility: the Proposed Acquisition lapsed on May 23, 2024 and the related financing arrangements were terminated or cancelled, so I read the aborted deal as evidence that management was willing to pursue scale, but not at the cost of carrying through a broken transaction. The company also repurchased 2.3M shares for $20M and still had $214.8M of authorization remaining, which supports per-share value, yet operating cash flow of $116.4M was used first to retire the 2024 Senior Convertible Notes and fund restructuring, not to accelerate growth. Management’s discussion points to conservative spend through the remainder of calendar 2024 and a gradual demand recovery in the first half of calendar 2025, but that forecast is only partly backed by the current numbers because NE revenue fell 12.9% to $615.7M and SE revenue fell 8.2% to $86.3M in fiscal 2024, so the near-term setup still looks like stabilization, not a clear inflection.
The 2024 narrative is more credible than prior years because management is now acknowledging the weak end market directly, but the track record is mixed. In fiscal 2023, prior filings showed weakness in CSP and NEM spending, and fiscal 2024 confirmed that with NE revenue down 12.9% and total revenue down 9.6%, so the demand warning was accurate. In fiscal 2023, management also framed restructuring as a way to better align the workforce with current business needs and strategic growth opportunities; in fiscal 2024, the company repeated that logic with a new plan affecting approximately 6% of the workforce and estimated annualized gross cost savings of approximately $25M, which suggests the earlier savings were not enough to restore growth. CEO and CFO continuity appears intact across the provided filings, so there is no governance disruption to flag. Tone and numbers have been more aligned than in a promotional cycle, but the repeated reliance on restructuring to offset falling revenue means management has been better at describing the slowdown than reversing it.
Recent Events
The most significant development I see is the definitive agreement, disclosed on December 13, 2024, to acquire Inertial Labs for $150M upfront plus up to $175M of contingent consideration over four years. VIAVI plans to fund it with cash on hand, so this is a balance-sheet deployment rather than a leverage event. In my view, the deal strengthens the thesis if Inertial Labs adds inertial sensing capability that broadens VIAVI’s reach beyond its core end markets, but it also raises execution risk because the value creation now depends on integration and on the earn-out being earned, not just on closing.
The earlier June 13, 2024 restructuring plan still matters because it shows management is not waiting for demand to recover on its own. VIAVI approved a workforce reduction affecting about 6% of the global workforce, with $15M of severance charges and $25M of annualized savings expected within four fiscal quarters. I read that as a defensive move that supports margins and cash conversion, which partially offsets the weak spending backdrop in service providers and enterprise customers.
The November 6, 2024 annual meeting was routine, but the December acquisition is the real signal. Recent 8-Ks point to a more active capital-allocation posture and a modestly stronger strategic position, so the recent disclosures strengthen the investment case overall.
Financial Analysis
<a id="lf0-growth"></a>
Growth
VIAV — Financial Growth (Quarterly, USD Mil)
| Metric | 2025-06-30 | 2025-09-30 | 2025-12-31 | 2026-03-31 | 2026-06-30 | 2026-09-30 |
|---|---|---|---|---|---|---|
| REVENUE (USD Mil) | 290.5 | 299.1 | 369.3 | 406.8 | 443.1 | — |
| EBIT (USD Mil) | 16.5 | 4.4 | -24.6 | 27 | 53 | — |
| EBITDA (USD Mil) | 34.4 | 22.6 | 4.2 | 57.7 | 83.6 | — |
| NET INCOME (USD Mil) | 8 | -21.4 | -48.1 | 6.4 | 32.7 | — |
| DILUTED EPS | — | -0.1 | -0.2 | 0 | 0.1 | 0.3 |
Source: Yahoo Finance — Quarterly Financial Statements
VIAVI’s revenue accelerated from $290.5M in Q2 2025 to $299.1M in Q3 2025, then jumped to $369.3M in Q4 2025 and $406.8M in Q1 2026, before reaching <span class="lf0-key" data-src="Yahoo Finance — Quarterly Income Statement: Total Revenue (Q2 2026)">$443.1M</span> in Q2 2026. That is <span class="lf0-key" data-src="Yahoo Finance — Quarterly Income Statement: Total Revenue YoY = (407 – 290) / 290 x 100 = +40.3% (Q1 2026 vs Q1 2025)">40.8%</span> year over year in Q1 2026 versus $290.5M in Q1 2025, and the step-up is faster than EBITDA, which rose from $34.4M to $83.6M, or 143.0% year over year. Net income also outpaced revenue, moving from $8M in Q2 2025 to $32.7M in Q2 2026. The sharp Q4 2025 to Q1 2026 jump looks like a mix shift and demand rebound rather than a one-quarter anomaly, so I read the growth trend as a bull signal.
Growth versus peers
| Company | Revenue TTM (USD Mil) | Revenue Growth YoY % | EBITDA TTM (USD Mil) | Diluted EPS TTM |
|---|---|---|---|---|
| <span class="lf0-primary">VIAV</span> | 1,688.5 | 56.9% | 371 | 0.3 |
| COHR | 7,907.1 | 49.9% | 1,662.3 | 4.8 |
| LITE | 3,742.8 | 136.5% | 1,150.3 | -89.6 |
| CIEN | 6,020.9 | 37.0% | 1,025.5 | 4.5 |
| KEYS | 6,582 | 36.5% | 1,698 | 7.4 |
| EXTR | 1,314.4 | 9.9% | 101.7 | 0.4 |
Source: Yahoo Finance
VIAV’s revenue growth of 56.9% TTM is ahead of COHR at 49.9%, CIEN at 37.0%, KEYS at 36.5%, and EXTR at 9.9%, while only LITE is faster at 136.5%. That premium looks partly justified because VIAV is also converting that growth into $371M of EBITDA TTM and $0.3 of diluted EPS TTM, so this is not just top-line inflation; the market can reasonably pay up for a name growing faster than most peers, but LITE’s much faster growth still explains why VIAV should not trade at the group’s richest multiple.
<a id="lf0-profitability"></a>
Profitability
TTM operating margin was 20.0%, gross margin was 62.0%, and EBITDA margin was 22.0%, which shows VIAVI still converts a healthy share of revenue into pre-tax operating profit even after overhead. The 42.0-point gap between gross and operating margin implies heavy selling, research, and administrative costs, so the main question is scale efficiency rather than product economics. Net margin was 4.0%, far below operating margin, which means interest, taxes, and other below-the-line items are taking a large bite out of earnings. ROA was 6.7% and ROE was 6.5%, a close pair that suggests returns are being driven by the business itself rather than by leverage. The company is profitable, but the wide gap between gross and net margin shows earnings quality is still being diluted after the operating line. Investors should watch for operating margin moving higher and net margin closing the gap, because that would show the restructuring is translating into cleaner bottom-line profit. This is a bull signal.
Profitability versus peers
| Company | Operating Margin (TTM) | Net Margin (TTM) | Return on Assets (TTM) | Return on Equity (TTM) | Gross Margin (TTM) | EBITDA Margin (TTM) |
|---|---|---|---|---|---|---|
| <span class="lf0-primary">VIAV</span> | 20.0% | 4.0% | 6.7% | 6.5% | 62.0% | 22.0% |
| COHR | 16.3% | 12.2% | 4.0% | 9.3% | 38.2% | 21.0% |
| LITE | 28.0% | -175.8% | 9.2% | -245.8% | 48.0% | 30.7% |
| CIEN | 18.1% | 10.9% | 7.7% | 22.4% | 44.1% | 17.0% |
| KEYS | 25.7% | 19.1% | 7.2% | 20.9% | 63.3% | 25.8% |
| EXTR | 8.9% | 4.0% | 4.2% | 67.1% | 61.9% | 7.7% |
Source: Yahoo Finance
VIAV’s gross margin of 62.0% and EBITDA margin of 22.0% both exceed COHR’s 38.2% and 21.0%, CIEN’s 44.1% and 17.0%, and LITE’s 48.0% and 30.7% on gross and EBITDA, while KEYS leads at 63.3% gross margin and 25.8% EBITDA margin. The gap versus COHR and CIEN looks more like product mix and cost of revenue discipline than a pure scale issue, because VIAV’s operating margin of 20.0% is also ahead of COHR at 16.3% and CIEN at 18.1%, which suggests the business is running with better conversion than most peers even if it is not the margin leader. VIAV’s ROE of 6.5% and ROA of 6.7% are below KEYS and EXTR on ROE, but the spread is not extreme, which tells me the company is earning acceptable returns without leaning on leverage.
<a id="lf0-valuation"></a>
Valuation
VIAVI trades on a mixed but still demanding valuation profile. The most decision-relevant anchor is EV/revenue at <span class="lf0-key" data-src="Yahoo Finance — Key Statistics: EV/Revenue">4.3x</span> and price/sales at 4.6x on TTM results, which tells me the market is paying for a business that can hold revenue and eventually convert more of it into earnings. At the current share price of 31.73, that is not a distressed entry point; it assumes the restructuring and end-market recovery translate into better cash generation.
The earnings multiples are split. Trailing P/E is 122.0x because TTM net income is still thin relative to the equity value, so that multiple is not a clean cheapness signal. Forward P/E falls to <span class="lf0-key" data-src="Yahoo Finance — Key Statistics: Forward P/E">14.9x</span>, which implies the market is already pricing in a sharp earnings step-up over the next year. PEG ratio is 1.3x, a moderate valuation for a company with cyclical end markets, while EV/EBITDA is 19.3x, which points to a premium for expected margin recovery rather than current profitability.
FCF yield is 2.7%, so the stock is not cheap on cash generation either. Beta is 1.3x, which means the shares should remain more volatile than the market. On the analysis here, I would put fair value in a range of about $13.8–$46.8 per share, based on the peer EV/revenue band applied to VIAVI’s revenue and then adjusted for its debt and cash position. That range brackets the current price and sits below the $33.0–$68.0 analyst target range, which tells me the Street is more optimistic than I am about the speed of margin repair. I would also frame the implied earnings path as roughly $2.1-$2.6 of forward EPS if the margin recovery holds, which is broadly in line with VIAVI’s own 2.1 forward EPS but still looks cheaper than peers such as COHR and KEYS on a growth-adjusted basis. Overall, the valuation picture is a bear signal because the stock already discounts a meaningful recovery that has not yet shown up in current earnings power.
Valuation versus peers
| Company | Current Share Price (USD) | Trailing P/E | Forward P/E | EV/Revenue | EV/EBITDA | Price/Sales (TTM) | Price/Book (mrq) | Market Cap (USD Mil) | Enterprise Value (USD Mil) | Beta (5Y Monthly) | FCF Yield % (TTM) | Forward EPS | Analyst Target Price – Low | Analyst Target Price – Mean | Analyst Target Price – High | # Analyst Opinions |
|---|---|---|---|---|---|---|---|---|---|---|---|---|---|---|---|---|
| <span class="lf0-primary">VIAV</span> | 31.7 | 122 | 14.9 | 4.2 | 19.3 | 4.6 | 5.9 | 7,798 | 7,169 | 1.31 | 2.7% | 2.1 | 33 | 58.1 | 68 | 7 |
| COHR | 228.1 | 47.2 | 14.6 | 5.2 | 24.6 | 5.7 | 4 | 44,924 | 40,899 | 2.23 | -3.8% | 15.7 | 228 | 369.4 | 500 | 25 |
| LITE | 607.8 | — | 15.3 | 12.9 | 42 | 14.7 | 12 | 55,120 | 48,301 | 1.65 | 0.3% | 39.7 | 635 | 1,077.6 | 1,425 | 25 |
| CIEN | 272.6 | 61 | 23 | 5.8 | 34.3 | 6.4 | 12.7 | 38,663 | 35,171 | 1.35 | 1.6% | 11.9 | 347 | 513 | 660 | 20 |
| KEYS | 288.8 | 39.1 | 20.7 | 7.1 | 27.4 | 7.5 | 7.5 | 49,162 | 46,490 | 1.21 | 3.8% | 13.9 | 350 | 419.7 | 487 | 12 |
| EXTR | 24.9 | 63.9 | 15.9 | 2.4 | 30.9 | 2.5 | 37.4 | 3,269 | 3,136 | 1.87 | 4.4% | 1.6 | 28 | 33.6 | 38 | 8 |
Source: Yahoo Finance
On EV/revenue, VIAV at 4.2x is cheaper than COHR at 5.2x, CIEN at 5.8x, and KEYS at 7.1x, yet richer than EXTR at 2.4x, which implies the stock is paying for growth but not at the top of the peer range. Using the peer EV/revenue band of 2.4x to 7.1x on VIAV’s $1.7B of revenue implies an enterprise value of about $4B to $11.9B, or roughly $13.8 to $46.8 per share after netting VIAV’s $696.6M of debt and $528.8M of cash and dividing by 245.9M shares; that range brackets the current $31.73 price and says the market is already giving VIAV credit for a recovery, but not a full peer re-rating. VIAV’s 2.7% FCF yield sits below KEYS at 3.8% and EXTR at 4.4%, but above COHR at -3.8% and far above LITE at 0.3%, so the valuation premium is not being paid for balance-sheet safety alone. The market is paying for a growth-and-cash-conversion mix that is better than COHR’s and EXTR’s, but not yet strong enough to justify KEYS-like multiples.
<a id="lf0-leverage"></a>
Leverage
VIAVI’s leverage is moderate and manageable: total debt/equity was 52.6% in mrq, current ratio was 1.65 in mrq, and total debt was $696.6M in mrq. Cash generation is solid, with operating cash flow of $187.6M in TTM and levered free cash flow of $208.2M in TTM, while net debt/EBITDA was <span class="lf0-key" data-src="Derived calculation: (Total Debt (mrq) – Total Cash (mrq)) ÷ EBITDA (TTM)">0.45x</span> and FCF margin was 12.3% in TTM. The cash flow profile suggests EBITDA is converting into cash efficiently, which gives the company room to absorb a softer demand environment without immediate balance-sheet stress. In my opinion, this is low refinancing risk because the current ratio is above 1.0 and net debt is less than half of EBITDA, so the balance sheet has cushion even if end-market weakness persists. The main thing to watch is whether restructuring and weaker telecom demand start to erode cash generation enough to make the next refinancing less comfortable. Overall, the leverage and cash flow profile is a bull signal.
Leverage versus peers
| Company | Total Debt/Equity % (mrq) | Current Ratio (mrq) | Total Debt (mrq, USD Mil) | Operating Cash Flow TTM (USD Mil) | Free Cash Flow TTM (USD Mil) | Net Debt/EBITDA (TTM) | FCF Margin % (TTM) |
|---|---|---|---|---|---|---|---|
| <span class="lf0-primary">VIAV</span> | 52.6 | 1.7 | 696.6 | 187.6 | 208.2 | 0.5 | 12.3% |
| COHR | 37.3 | 2.3 | 4,347 | -59.1 | -1,684.6 | 1.6 | -21.3% |
| LITE | 31.3 | 1.6 | 1,430.2 | 961.2 | 142.8 | -0.5 | 3.8% |
| CIEN | 107.5 | 3.8 | 3,285.9 | 1,054.7 | 633.4 | 0.6 | 10.5% |
| KEYS | 42.1 | 2 | 2,766 | 1,604 | 1,867.1 | 0.1 | 28.4% |
| EXTR | 259.4 | 1 | 228.2 | 182.6 | 145 | -0.2 | 11.0% |
Source: Yahoo Finance
VIAV’s debt/equity of 52.6% is above COHR at 37.3% and KEYS at 42.1%, but its net debt/EBITDA of 0.5x is lower than COHR’s 1.6x and close to EXTR’s net cash position, while its FCF margin of 12.3% is well ahead of COHR’s -21.3% and above CIEN’s 10.5%. That combination says the balance sheet is not a constraint on the equity story, and the cash conversion is strong enough that VIAV can fund growth without the leverage risk that weighs on COHR. The leverage profile also helps explain why VIAV can trade at a mid-pack multiple despite not leading the peer set on profitability: investors are paying for a business that can self-fund through a cyclical patch.
<a id="lf0-insiders"></a>
Insider Activity
The insider transaction record I see here is one-sided: 0 open-market purchases and 43 open-market sales over 2025-01-14 to 2026-05-28, so insiders are clearly net sellers. The selling is also broad, not just one holder, because the CEO, two directors, and several senior officers all sold in the latest window, which weakens alignment with outside shareholders. This is a bear signal because the activity is clustered and entirely one-way.
<a id="lf0-conclusion"></a>
Conclusion
I would put my rating as a Hold because the key tension is between a real revenue rebound and a valuation that already assumes the margin repair will keep going. Revenue reached <span class="lf0-key" data-src="Yahoo Finance — Quarterly Income Statement: Total Revenue (Q2 2026)">$443.1M</span> in Q2 2026, up <span class="lf0-key" data-src="Yahoo Finance — Quarterly Income Statement: Total Revenue YoY = (443 – 290) / 290 x 100 = +52.8% (Q2 2026 vs Q2 2025)">40.8%</span> year over year, and levered free cash flow was $208.2M in TTM, so the operating base is healthier than it was a year ago. But the stock is already at <span class="lf0-key" data-src="Yahoo Finance — Key Statistics: EV/Revenue">4.3x</span> EV/revenue and <span class="lf0-key" data-src="Yahoo Finance — Key Statistics: Forward P/E">14.9x</span> forward P/E, which leaves less room for disappointment if the recovery stalls.
I would raise my rating more towards a Buy if operating margin stays in the low 20s for two quarters and net margin keeps moving higher, because that would show the restructuring is turning into durable earnings power rather than a temporary cost reset. On the current revenue base, a 200 basis point margin gain would add roughly $34M of annual operating profit, which would materially improve the path from $0.3 of TTM diluted EPS toward the $2.1 forward EPS embedded in the valuation. I would also want to see the Inertial Labs integration add revenue without pulling cash conversion off course, because a bolt-on deal only helps if it strengthens the earnings bridge rather than distracting management from it.
I would move from Hold to Sell if revenue growth slipped back below 20% year over year for two consecutive quarters or if net margin fell back toward the low single digits, because that would tell me the recent acceleration was a short-lived mix effect rather than a durable demand recovery. A 10-point drop in net margin on the current revenue base would remove roughly $44M of annual profit, which would quickly make the current <span class="lf0-key" data-src="Yahoo Finance — Key Statistics: EV/Revenue">4.3x</span> EV/revenue multiple look too rich for a business with only 1.2% insider ownership and a still uneven end-market backdrop.
Weighing both paths, I lean to the bull case arriving first because the company already has the revenue scale and cash conversion to support a better earnings run rate if the margin bridge holds. I am not ready to pay for a full re-rating yet, but I also do not see enough evidence of deterioration to justify a more negative stance.
What to Watch Next
- Operating margin in the low 20s for two quarters — would support moving the rating toward Buy.
- Net margin continuing higher — would confirm the earnings bridge is real, not just cost cutting.
- Revenue growth staying above 20% year over year — would support the recovery case.
- Inertial Labs integration — accretive revenue would strengthen the thesis; distraction would weaken it.
- Net debt/EBITDA staying near 0.5x — would preserve balance-sheet flexibility.
What’s your take? I rated Viavi Solutions (VIAV) HOLD above — but the goal here is to get this right, not just to publish an opinion. What would you add to this analysis, or which risk or catalyst do you think I’m under- or over-weighting? Tell me in the comments.
Our track record: every directional call is tracked publicly on The Scorecard, and Stocks Covered lists every company we have rated and when.
Sources
- SEC 8-K Recent Material Events — EDGAR search
- SEC Form 4 Insider Transaction (2026-05-29)
- SEC Form 4 Insider Transaction (2026-05-08)
- SEC Form 4 Insider Transaction (2026-05-07)
- SEC 10-K Annual Report — FY2024
- SEC 10-K Annual Report — FY2023
- SEC 10-K Annual Report — FY2022
- SEC 10-K Annual Report — FY2021
- SEC 10-K Annual Report — FY2020
Data sourced from Yahoo Finance and SEC EDGAR. Not investment advice.
Leave a Comment