Expected price range
Each range is set from the stock’s recent price history and our Hold rating, using its own 1-year realised volatility (29% annualised) as the width of a ~68% statistical band, and checked against that rating so the range leans the same way as our view. Starting price $559 (close 2026-10-30). The stock traded between $424 and $559 over the last 6 months and between $409 and $559 over the last year. This is an illustration of where our view and normal volatility point, not a forecast, price target or investment advice; the stock can move outside it.
| Company | Nov 25 | Dec 25 | Jan 26 | Feb 26 | Mar 26 | Apr 26 | May 26 | Jun 26 | Jul 26 | Aug 26 | Sep 26 | Oct 26 | 12-Mo |
|---|---|---|---|---|---|---|---|---|---|---|---|---|---|
| VRTX | +2% | +5% | +4% | +6% | -10% | -4% | +5% | +11% | -4% | +14% | -4% | +7% | +31% |
| CRSP | -16% | -2% | -5% | +20% | -21% | +10% | +7% | -3% | -12% | +19% | -3% | -7% | -20% |
| BMRN | +4% | +6% | -5% | +9% | -8% | -5% | +6% | -0% | +5% | +9% | -8% | -2% | +9% |
| BEAM | +1% | +9% | -0% | +3% | -16% | +27% | +9% | +4% | -26% | +15% | -17% | +11% | +9% |
| NTLA | -29% | +0% | +46% | +5% | -7% | +5% | +4% | +20% | -37% | +19% | -5% | +3% | -1% |
| TEM | -13% | -24% | +1% | -11% | -15% | +23% | -9% | +15% | -24% | +44% | +30% | -12% | -20% |
Source: Yahoo Finance monthly adjusted close.
Quick Thesis
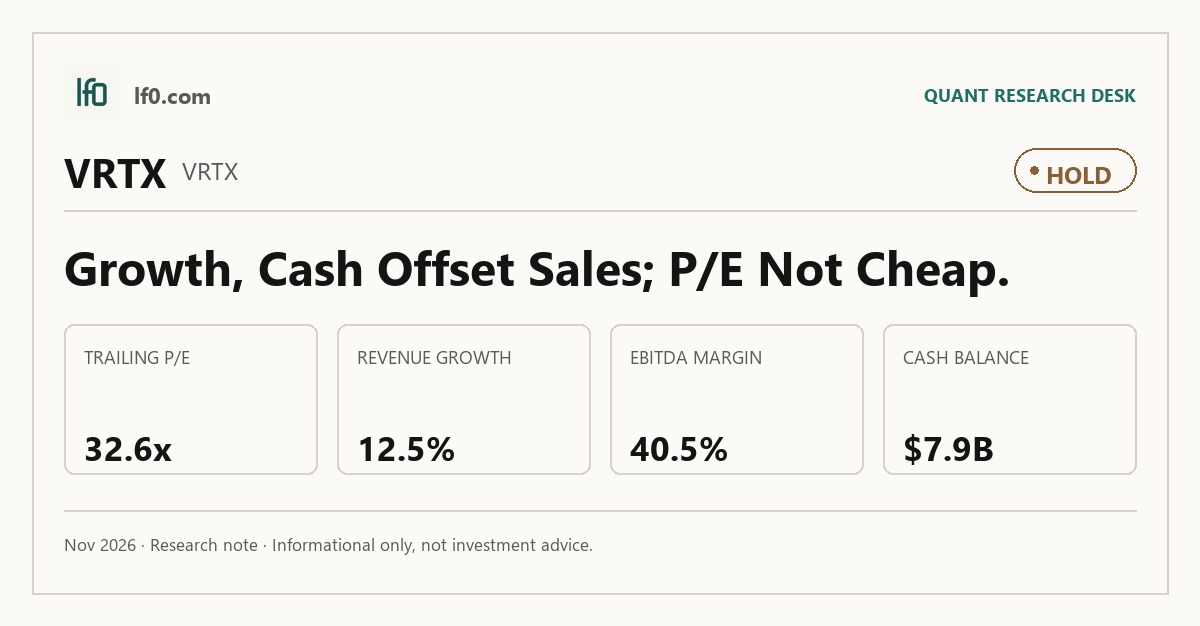
- Rated hold — Vertex is priced for durable execution, not a turnaround.
- Strongest financial point: $2.6B of levered free cash flow in TTM 2025.
- Main risk: CF concentration still drives substantially all net product revenue.
- Valuation is rich at 32.6x trailing P/E and 27.4x forward P/E.
- I would turn more constructive if ALYFTREK royalties settle near 4% and JOURNAVX keeps scaling.
Executive Summary
Rating: HOLD | VRTX
We’ll begin tracking this call’s performance since publication once sufficient adjusted-close data is available.
I would put my rating as a hold because Vertex already trades like a high-quality compounder, with 32.6x trailing P/E and 27.4x forward P/E leaving little margin for disappointment. The strongest part of the case is cash generation: the company produced $2.6B of levered free cash flow in TTM 2025 and still held a 3.19x current ratio, so the balance sheet is not the constraint. The issue is that the market is already paying for that quality while CF remains the earnings anchor, which means the stock needs continued execution rather than multiple expansion.
I would raise my rating more towards a buy if ALYFTREK royalty terms settle near 4% and JOURNAVX keeps scaling beyond 550,000 prescriptions, because that would show the non-CF platform is becoming more material. If revenue can keep growing in the low double digits from a $12.6B base while operating margin holds near 38.1%, the current multiple becomes easier to defend because earnings would be compounding from a larger base.
Company Profile
Vertex Pharmaceuticals is a biotechnology company focused on cystic fibrosis, sickle cell disease, transfusion-dependent beta thalassemia, and acute pain. It sells CF therapies, led by TRIKAFTA/KAFTRIO and ALYFTREK, through specialty pharmacies and wholesalers, and recognizes revenue when products are delivered or, for CASGEVY, when infusion occurs. The company was founded in 1989 and has expanded through deals such as the 2024 Alpine Immune Sciences acquisition, which added povetacicept, and the 2017 CRISPR Therapeutics joint development and commercialization agreement for CASGEVY. It is based in Boston and operates a large manufacturing and research footprint, including a 348,000 square foot Leiden II campus building expected online in late 2026.
Economic Moat
Business Model
The most defensible part of Vertex’s model is the CF franchise, because it combines strong pricing power with a reimbursement and distribution network that is hard to replicate quickly. ALYFTREK generated $837.8M of product revenue in 2025, and Vertex says its royalty burden is 4%, while Royalty Pharma is arbitrating for roughly 8%; that spread matters because every point of royalty leakage changes how much cash can be reinvested or returned. I also see a real operating moat in access and manufacturing: by year-end 2025, over 200 million individuals across commercial and government payers had coverage for JOURNAVX, and about 90% of people with SCD or TDT in the U.S. had reimbursed access to CASGEVY. That access layer, plus the company’s manufacturing base, is harder to build than a single drug approval.
Business & Operating Risks
The main disclosed risk is still CF concentration, because substantially all net product revenue comes from that franchise and Vertex warns that competitive products or weaker next-generation launches could pressure it. Pricing and reimbursement pressure is the second risk, with the filing pointing to government action, PDAB scrutiny, and the CMS GUARD Model as ways net pricing could be squeezed. Development and commercialization risk also remains real for JOURNAVX, CASGEVY, and the broader pain pipeline, where manufacturing complexity and competition can slow adoption. Taken together, these risks do not break the moat, but they do threaten the cash engine that supports it if CF momentum slows.
Management Discussion & Analysis
Management is clearly using the CF cash engine to fund launches and pipeline expansion rather than to maximize near-term margins. R&D and SG&A rose to $5.7B in 2025 from $5.1B in 2024, while cash, cash equivalents and marketable securities increased to $12.3B, which tells me Vertex is funding growth internally rather than stretching the balance sheet. That is constructive, but it also means buybacks, launches, and development spend are competing for capital at the same time. The company is still talking like a broader platform, yet 2025 revenue of $12.0B was still driven mainly by CF, so the earnings base remains concentrated even as spending broadens.
Recent Events
The most important recent event is the March 31, 2026 rolling BLA submission for povetacicept in IgAN, which Vertex is trying to accelerate with a priority review voucher. That matters because it pulls a potential catalyst forward and shows the company is still converting late-stage science into a nearer-term regulatory path. The February 12, 2026 earnings release was more of a confirmation than a reset, while the April 28, 2026 CFO transition and the May 13, 2026 shareholder approvals were modest governance updates rather than strategic changes. None of those events weakens the moat; if anything, they show the company is still using its balance sheet and development engine to extend the platform.
Financial Analysis
Growth
VRTX — Financial Growth (Quarterly, USD Mil)
| Metric | 2025-06-30 | 2025-09-30 | 2025-12-31 | 2026-03-31 | 2026-06-30 |
|---|---|---|---|---|---|
| REVENUE (USD Mil) | 2,964.7 | 3,076.4 | 3,190 | 2,986.9 | 3,333.9 |
| EBIT (USD Mil) | 1,154.2 | 1,302.1 | 1,334.3 | 1,138.8 | 1,268.7 |
| EBITDA (USD Mil) | 1,205.9 | 1,356.1 | 1,390 | 1,194.7 | 1,325.2 |
| NET INCOME (USD Mil) | 1,032.9 | 1,082.9 | 1,191.1 | 1,031.4 | 1,099.8 |
| DILUTED EPS | 4 | 4.2 | 4.7 | 4 | 4.3 |
Source: Yahoo Finance — Quarterly Financial Statements
Revenue rose to $3.33B in Q2 2026 from $2.99B in Q1 2026, and that sequential rebound followed $3.19B in Q4 2025. EBITDA increased to $1.33B in Q2 2026, while net income reached $1.1B, so earnings are still tracking the top line closely rather than lagging it. I read that as healthy operating momentum, not a one-off spike, and it fits a business that is still scaling from a large base.
Profitability
VRTX — Profitability (TTM)
| Metric | TTM |
|---|---|
| Operating Margin (TTM) | 38.1% |
| Net Margin (TTM) | 35.0% |
| Return on Assets (TTM) | 11.9% |
| Return on Equity (TTM) | 23.5% |
| Gross Margin (TTM) | 55.0% |
| EBITDA Margin (TTM) | 40.5% |
Source: Yahoo Finance — Trailing Twelve Months (TTM)
TTM operating margin was 38.1%, net margin 35.0%, gross margin 55.0%, and EBITDA margin 40.5%, which is a very strong spread for a commercial-stage biotech company. Return on assets was 11.9% and return on equity was 23.5%, so the company is generating real economic returns rather than relying on financial engineering. The gap between gross and EBITDA margin shows heavy reinvestment in R&D and SG&A, but that spend is still being funded by a high-margin core franchise, which is why the moat and the financials reinforce each other.
Valuation
VRTX — Valuation Multiples
| Metric | Value |
|---|---|
| Current Share Price (USD) | 558.9 |
| Market Cap (USD Mil) | 141,564 |
| Enterprise Value (USD Mil) | 135,779 |
| Trailing P/E | 32.5 |
| Forward P/E | 27.4 |
| Price/Sales (TTM) | 11.2 |
| Price/Book (mrq) | 7 |
| EV/Revenue | 10.8 |
| EV/EBITDA | 26.6 |
| Beta (5Y Monthly) | 0.28 |
| FCF Yield % (TTM) | 1.9% |
| Forward EPS (USD) | 20.4 |
| Analyst Target Price – Low (USD) | 350 |
| Analyst Target Price – Mean (USD) | 571.5 |
| Analyst Target Price – High (USD) | 667 |
| # Analyst Opinions | 28 |
Source: Yahoo Finance
Vertex trades at 32.6x trailing P/E, 27.4x forward P/E, 10.8x EV/revenue, and 26.6x EV/EBITDA, with a 1.9% FCF yield and a 7.0x price/book multiple. At $558.9 per share, the stock is priced as a premium quality compounder, not a bargain, and the 28 analyst opinions with a $571.5 mean target suggest the market is already close to consensus fair value. On my read, fair value sits roughly in the mid-$500s to low-$600s, which is broadly in line with the analyst range of $350 to $667 but closer to the mean than the extremes. I would not call that cheap given the leverage-free balance sheet and strong margins, but I also would not call it stretched enough to imply a broken thesis.
The implied earnings path matters as much as the multiple. With forward EPS at 20.4, the market is paying for a continuation of high-teens to low-20s earnings growth rather than a step-change in profitability, and that is a reasonable ask only if the non-CF platform starts contributing more visibly. In other words, the valuation is supported by quality, but the next leg of upside depends on broadening the earnings base rather than simply defending the CF franchise.
Leverage
VRTX — Leverage & Coverage (Quarterly)
| Metric | Value |
|---|---|
| Total Debt/Equity % (mrq) | 9.8 |
| Current Ratio (mrq) | 3.2 |
| Total Debt (mrq, USD Mil) | 1,977.6 |
| Operating Cash Flow (TTM, USD Mil) | 4,292.9 |
| Levered Free Cash Flow (TTM, USD Mil) | 2,627.9 |
| Net Debt/EBITDA (TTM) | -1.2 |
| FCF Margin % (TTM) | 20.9% |
Source: Yahoo Finance — Quarterly Financial Statements
Total debt/equity was 9.767%, current ratio was 3.185, and total debt was $1,978M, versus operating cash flow of $4,293M and levered free cash flow of $2,628M. Net debt/EBITDA was -1.2x, which means Vertex is net cash positive rather than levered, and that gives it room to fund R&D, launches, and buybacks without stressing the capital structure. The balance sheet is therefore a support to the thesis, not a source of risk.
Insider Activity
The insider tape is one-sided selling. There were 87 open-market sales totaling $101.3M and no open-market purchases in the 2025-02-04 to 2026-06-01 window, with sales spread across senior executives and a director. I do not read that as a thesis breaker, but it does tell me insiders are not signaling that the stock is obviously cheap.
Comparable Analysis
LF0 has published standalone analyses of these peers: CRISPR Therapeutics (CRSP) (rated Strong Sell).
Growth
| Company | Revenue TTM (USD Mil) | Revenue Growth YoY % | EBITDA TTM (USD Mil) | Diluted EPS TTM |
|---|---|---|---|---|
| VRTX | 12,587.2 | 12.5% | 5,100.5 | 17.2 |
| CRSP | 13.4 | 1,041.4% | -513.2 | -4.7 |
| BMRN | 3,406.6 | 19.9% | 645.3 | 0.4 |
| BEAM | 156 | -94.2% | -355.8 | -0.7 |
| NTLA | 59.5 | -46.2% | -414.4 | -3.4 |
| TEM | 1,432 | 21.6% | -202.4 | -1.4 |
Source: Yahoo Finance
VRTX’s revenue grew 12.5% year over year on $12.6B of TTM revenue, which is slower than BMRN’s 19.9% and TEM’s 21.6% but far better than CRSP’s 1,041.4% off a tiny base and NTLA’s -46.2% decline. I think that growth is more durable than the fastest growers because it comes from a much larger revenue base and is already paired with $5.1B of EBITDA and $17.2 of diluted EPS.
Valuation
| Company | Current Share Price (USD) | Trailing P/E | Forward P/E | EV/Revenue | EV/EBITDA | Price/Sales (TTM) | Price/Book (mrq) | Market Cap (USD Mil) | Enterprise Value (USD Mil) | Beta (5Y Monthly) | FCF Yield % (TTM) | Forward EPS | Analyst Target Price – Low | Analyst Target Price – Mean | Analyst Target Price – High | # Analyst Opinions |
|---|---|---|---|---|---|---|---|---|---|---|---|---|---|---|---|---|
| VRTX | 558.9 | 32.5 | 27.4 | 10.8 | 26.6 | 11.2 | 7 | 141,564 | 135,779 | 0.28 | 1.9% | 20.4 | 350 | 571.5 | 667 | 28 |
| CRSP | 51.4 | — | -14.5 | 253.2 | -6.6 | 371.3 | 2.8 | 4,972 | 3,391 | 1.90 | -4.3% | -3.6 | 44 | 85.6 | 291 | 19 |
| BMRN | 58.5 | 158.1 | 9.1 | 4.3 | 22.7 | 3.3 | 1.8 | 11,326 | 14,654 | 0.23 | 0.8% | 6.4 | 60 | 91.6 | 122 | 27 |
| BEAM | 27.2 | — | -5.7 | 11.6 | -5.1 | 18 | 2.5 | 2,813 | 1,815 | 2.22 | -8.6% | -4.7 | 26 | 49.4 | 80 | 13 |
| NTLA | 12.5 | — | -4.9 | 23.2 | -3.3 | 29.4 | 2.4 | 1,747 | 1,383 | 1.82 | -14.3% | -2.6 | 8 | 23.1 | 61 | 18 |
| TEM | 72.2 | — | -1,556.8 | 9.5 | -67.5 | 9.2 | 29.2 | 13,162 | 13,659 | 3.61 | -0.8% | 0 | 35 | 75.1 | 100 | 18 |
Source: Yahoo Finance
VRTX trades at 10.8x EV/revenue, 32.6x trailing P/E, and 27.4x forward P/E, versus BMRN at 4.3x EV/revenue and 9.1x forward P/E, while TEM sits at 9.5x EV/revenue but with negative forward EPS. On a peer basis, VRTX looks expensive versus BMRN, but the premium is easier to justify because VRTX also has $20.4 of forward EPS, $2.6B of TTM free cash flow, and a much stronger balance sheet. The stock’s $1 invested a year ago would be worth $1.31 today, which is better than BMRN, BEAM, NTLA, and TEM, and that performance supports the idea that the market is paying for quality rather than just momentum. I would still say the multiple is full, not cheap, because the peer set does not show a growth premium large enough to make the current valuation look obviously discounted.
Profitability
| Company | Operating Margin (TTM) | Net Margin (TTM) | Return on Assets (TTM) | Return on Equity (TTM) | Gross Margin (TTM) | EBITDA Margin (TTM) |
|---|---|---|---|---|---|---|
| VRTX | 38.1% | 35.0% | 11.9% | 23.5% | 55.0% | 40.5% |
| CRSP | -1,127.6% | 0.0% | -14.2% | -26.1% | -3,448.3% | -3,831.9% |
| BMRN | 21.2% | 2.1% | 3.3% | 1.2% | 51.0% | 18.9% |
| BEAM | -25,827.1% | -55.4% | -17.0% | -8.2% | -161.9% | -228.0% |
| NTLA | -1,472.3% | 0.0% | -30.1% | -55.4% | -374.4% | -696.4% |
| TEM | -19.6% | -17.8% | -8.8% | -67.4% | 64.0% | -14.1% |
Source: Yahoo Finance
VRTX’s 38.1% operating margin, 35.0% net margin, 55.0% gross margin, and 40.5% EBITDA margin all sit well above BMRN’s 21.2%, 2.1%, 51.0%, and 18.9%, while CRSP, BEAM, NTLA, and TEM are loss-making on operating and EBITDA lines. That margin gap is structural, not cyclical, because VRTX combines high gross margin with high operating margin, which tells me the company has both pricing power and operating discipline. ROE of 23.5% and ROA of 11.9% also show that the business is generating genuine returns rather than relying on leverage.
Leverage
| Company | Total Debt/Equity % (mrq) | Current Ratio (mrq) | Total Debt (mrq, USD Mil) | Operating Cash Flow TTM (USD Mil) | Free Cash Flow TTM (USD Mil) | Net Debt/EBITDA (TTM) | FCF Margin % (TTM) |
|---|---|---|---|---|---|---|---|
| VRTX | 9.8 | 3.2 | 1,977.6 | 4,292.9 | 2,627.9 | -1.2 | 20.9% |
| CRSP | 44.9 | 17.8 | 783.8 | -369.6 | -215.8 | 3.1 | -1,611.8% |
| BMRN | 66.5 | 2.4 | 4,202.2 | 857.1 | 85.2 | 5.2 | 2.5% |
| BEAM | 23.2 | 14.6 | 247.4 | -359.4 | -241.8 | 2.5 | -155.0% |
| NTLA | 10.1 | 6.6 | 73.4 | -346.6 | -249.8 | 0.9 | -419.8% |
| TEM | 324.6 | 3.3 | 1,444.2 | -237.4 | -99.2 | -3.1 | -6.9% |
Source: Yahoo Finance
VRTX’s 9.767% debt/equity ratio and -1.2x net debt/EBITDA compare favorably with BMRN’s 66.5% and 5.2x, CRSP’s 44.9% and 3.1x, and TEM’s 324.6% and -3.1x. The current ratio of 3.185 and FCF margin of 20.9% reinforce the same point: Vertex has more financial flexibility than most of the peer set, and that flexibility is part of why the market awards it a premium multiple. Lower leverage also helps explain why VRTX can sustain a richer valuation than peers with similar growth, because investors are paying for both earnings quality and balance-sheet safety.
Conclusion
I would put my rating as a hold because the key tension is no longer whether Vertex can grow, but whether the market is already paying for that growth before the non-CF platform becomes large enough to matter. The company is still producing strong margins and $2.6B of levered free cash flow, yet CF concentration remains the central dependency, so I want to see the next phase of earnings broaden before I get more aggressive.
I would raise my rating more towards a buy if povetacicept gets a clean regulatory path and JOURNAVX keeps scaling fast enough to lift non-CF revenue meaningfully above the current base. If Vertex can keep revenue growing in the low double digits from a $12.6B base while holding operating margin near 38.1%, that would add roughly $1.3B of incremental revenue and about $500M of incremental operating profit at the current margin, which would make the current multiple easier to defend because earnings would be compounding from a much larger base.
I would move from hold to sell if CF concentration starts to leak into the numbers, especially if product revenue growth slows to the high single digits or if reimbursement pressure trims EBITDA margin by even 200 bps from the current 40.5%. A 200 bps drop on $12.6B of revenue would cut EBITDA by about $252M, which would slow buybacks, reduce pipeline flexibility, and make the valuation look less forgiving. For now, I think the bull case is real but already well recognized, so the stock needs execution rather than multiple expansion to justify a higher rating.
What to Watch Next
- ALYFTREK royalty resolution near 4% — would improve CF cash conversion.
- JOURNAVX prescriptions above 550,000 — would support a higher rating.
- Non-CF revenue mix rising meaningfully — would reduce concentration risk.
- Operating margin staying near 38.1% — would confirm earnings quality.
- EBITDA margin slipping by 200 bps or more — would pressure the valuation case.
What’s your take? I rated Vertex Pharmaceuticals (VRTX) HOLD above — but the goal here is to get this right, not just to publish an opinion. What would you add to this analysis, or which risk or catalyst do you think I’m under- or over-weighting? Tell me in the comments.
Our track record: every directional call is tracked publicly on The Scorecard, and Stocks Covered lists every company we have rated and when.
Sources
- SEC 10-K Annual Report — filed 2026-02-13
- SEC 8-K Filing (2026-05-13)
- SEC 8-K Filing (2026-05-04)
- SEC 8-K Filing (2026-04-29)
- SEC 8-K Filing (2026-03-31)
- SEC 8-K Filing (2026-02-12)
- SEC Form 4 Insider Transaction (2026-06-03)
- SEC Form 4 Insider Transaction (2026-06-02)
- SEC Form 4 Insider Transaction (2026-05-19)
- SEC 10-K Annual Report — FY2026
- SEC 10-K Annual Report — FY2025
- SEC 10-K Annual Report — FY2024
- SEC 10-K Annual Report — FY2023
- SEC 10-K Annual Report — FY2022
Data sourced from Yahoo Finance and SEC EDGAR. Not investment advice.
Leave a Comment