
Expected price range
Each range is set from the stock’s recent price history and our Strong Sell rating, using its own 1-year realised volatility (113% annualised) as the width of a ~68% statistical band, and checked against that rating so the range leans the same way as our view. Starting price $6.39 (close 2026-10-30). The stock traded between $3.83 and $9.93 over the last 6 months and between $1.97 and $9.93 over the last year. This is an illustration of where our view and normal volatility point, not a forecast, price target or investment advice; the stock can move outside it.
| Company | Nov 25 | Dec 25 | Jan 26 | Feb 26 | Mar 26 | Apr 26 | May 26 | Jun 26 | Jul 26 | Aug 26 | Sep 26 | Oct 26 | 12-Mo |
|---|---|---|---|---|---|---|---|---|---|---|---|---|---|
| BFLY | +15% | +23% | +4% | -4% | +7% | +19% | -5% | +85% | -16% | +11% | +14% | -29% | +138% |
| GEHC | +7% | +3% | -4% | +7% | -16% | -14% | +2% | +3% | +6% | +5% | -8% | +17% | +2% |
| PHG | +3% | -4% | +6% | +11% | -14% | -4% | +4% | +3% | -3% | +1% | -8% | +10% | +2% |
| NNOX | +23% | -38% | -2% | -13% | -4% | -25% | +12% | -40% | -16% | -18% | -14% | -52% | -91% |
| FUJIF | -16% | -4% | -2% | +3% | -1% | -1% | +4% | +4% | +6% | -9% | +3% | +5% | -9% |
| BSX | +1% | -6% | -2% | -18% | -18% | -8% | -16% | -12% | +9% | +3% | -10% | -4% | -58% |
Source: Yahoo Finance monthly adjusted close.
Quick Thesis
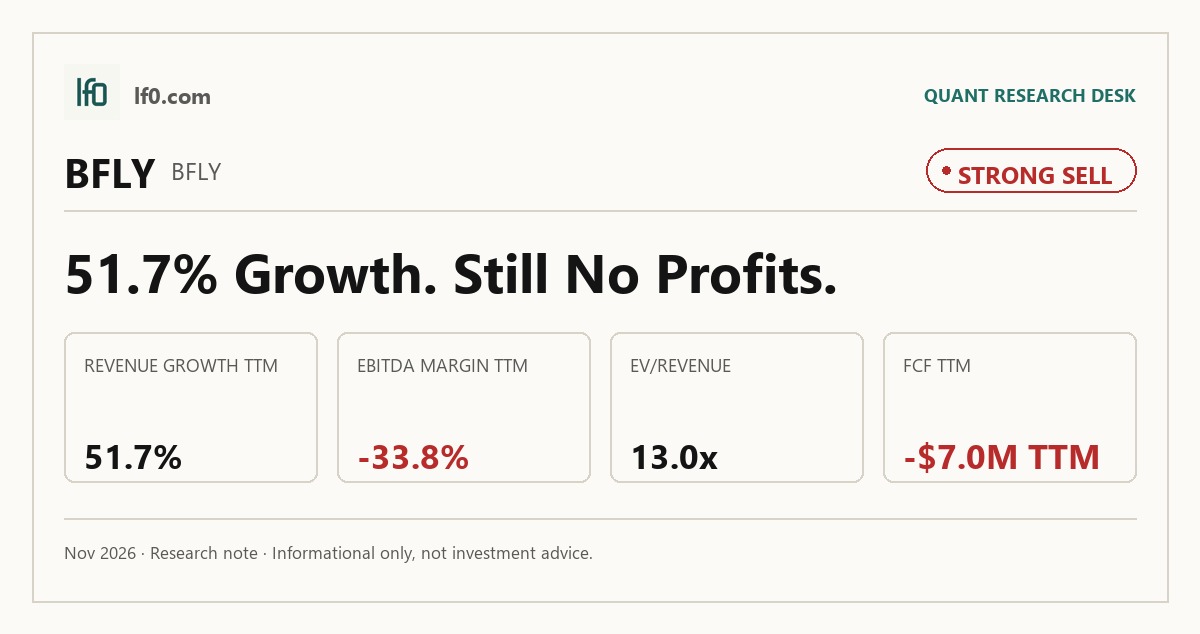
- Rated Strong Sell — the stock is priced for a turnaround that the numbers do not yet support.
- Revenue reached 32.6M in Q3 2026, but EBITDA was still -10.9M TTM.
- The main risk is single-supplier exposure to TSMC, while short interest is 15.6% of float.
- Valuation is rich at 13.0x EV/revenue versus peers trading near 1.8x-3.5x.
- I would improve my view only if revenue stays above 32M and operating margin moves toward breakeven.
Executive Summary
Rating: STRONG SELL | BFLY
We’ll begin tracking this call’s performance since publication once sufficient adjusted-close data is available.
I would put my rating as a Strong Sell because Butterfly Network is still not converting revenue growth into durable earnings or cash flow. Revenue reached 32.6M in Q3 2026, but TTM operating margin was -29.3% and levered free cash flow was -7M</span>, so the market is paying for a scale-up that has not yet shown self-funding economics. I would move toward a Buy only if revenue holds above 32M for two more quarters and operating margin moves materially closer to breakeven, because that would show the current run rate is not a one-quarter spike and that overhead is finally being absorbed.
Company Profile
Butterfly Network develops and sells portable ultrasound devices built around its semiconductor-based Ultrasound-on-Chip platform, along with cloud-connected software, subscriptions, support, and related services. Revenue comes from point-in-time sales of probes, accessories, and chips, plus recurring software and service revenue. The company was incorporated in Delaware in 2020 and became Butterfly Network through its 2021 business combination. It operates subsidiaries in the U.S., Australia, Germany, the Netherlands, Taiwan, and the U.K., and sells through direct sales, distributors, and eCommerce. Butterfly is listed on the NYSE under BFLY.
Economic Moat
Business Model
The most defensible part of Butterfly’s model is the Ultrasound-on-Chip platform, because I feel a competitor would struggle to replicate that semiconductor stack quickly. The company owns about 665 issued patents and pending applications, with expected expiration dates running from 2030 to 2046, and it also licenses wafer bonding technology from Stanford on a non-exclusive basis. That mix supports product differentiation, while the 2025 Midjourney Co-Development and Licensing Agreement adds a five-year channel for monetizing the platform beyond direct device sales. The software and services layer is the other important support: it reached 35.0% of revenue in 2025, up 1.1 percentage points from 2024, which tells me the mix is slowly shifting toward more recurring revenue.
Business & Operating Risks
The biggest disclosed risk is dependence on TSMC, which Butterfly says manufactures and supplies all wafers for its Ultrasound-on-Chip technology without committing to volumes beyond forecasted needs. That creates supply interruption risk, and it also leaves the company exposed to buyback obligations on unused wafers. Commercialization risk is the other major issue: the filing says the company has a limited operating history, has incurred repeated losses, and does not know when it will become profitable. In my view, those risks do not break the moat itself, but they do threaten the company’s ability to turn its patent-backed advantage into durable economics.
Management Discussion & Analysis
Management is clearly trying to push the business toward a higher software mix and lower cash burn, but the operating results show that the transition is still incomplete. The company raised $81M net in January 2025, which extended liquidity, yet it still reported negative operating cash flow and a net loss in FY2025. That tells me management is responding to the funding risk, but not yet solving the profitability problem. The mix shift is real, and it is consistent with the moat thesis above, but the current numbers still show a business that needs more scale before the model can stand on its own.
Recent Events
The most important recent event was the board refresh in May 2026. Dr. Erica Schwartz’s contingent resignation and Caroll H. Neubauer’s appointment kept the board fully staffed, and Neubauer’s committee roles add oversight in technology and compensation, both relevant to a company whose moat depends on product development. The January 2026 NYSE notice on public warrants was also useful, because it effectively removed a small capital-structure overhang without changing the operating thesis. Taken together, the recent filings are mildly constructive on governance, but they do not change the core question of whether the company can turn its technology edge into sustained earnings power.
Financial Analysis
Growth
BFLY — Financial Growth (Quarterly, USD Mil)
| Metric | 2025-09-30 | 2025-12-31 | 2026-03-31 | 2026-06-30 | 2026-09-30 |
|---|---|---|---|---|---|
| REVENUE (USD Mil) | 21.5 | 31.5 | 26.5 | 32.6 | 32.6 |
| EBIT (USD Mil) | -33.6 | -14.8 | -12.4 | -12.6 | -12.5 |
| EBITDA (USD Mil) | -31.7 | -13.1 | -10.6 | -11 | -10.9 |
| NET INCOME (USD Mil) | -34 | -15.3 | -12.7 | -12.9 | -12.8 |
| DILUTED EPS | -0.1 | -0.1 | -0.1 | -0.1 | -0.1 |
Source: Yahoo Finance — Quarterly Financial Statements
Revenue rebounded from 21.5M in Q3 2025 to 31.5M in Q4 2025, then settled at 26.5M in Q1 2026 before returning to 32.6M in both Q2 and Q3 2026. That pattern shows real top-line traction, but it also shows that growth has cooled after the initial jump, so I would not treat the latest run rate as proof of a durable step-up yet. EBITDA stayed negative throughout the period and improved only modestly, which means the business is still growing faster than it is absorbing fixed costs.
Profitability
BFLY — Profitability (TTM)
| Metric | TTM |
|---|---|
| Operating Margin (TTM) | -29.2% |
| Net Margin (TTM) | -43.6% |
| Return on Assets (TTM) | -9.6% |
| Return on Equity (TTM) | -27.7% |
| Gross Margin (TTM) | 70.3% |
| EBITDA Margin (TTM) | -33.8% |
Source: Yahoo Finance — Trailing Twelve Months (TTM)
TTM gross margin was 70.3%, while operating margin was -29.3%, EBITDA margin was -33.8%, net margin was -43.6%, ROA was -9.6%, and ROE was -27.7%. The spread between gross margin and operating margin is 99.6 percentage points, which tells me the product itself is healthy before overhead, but sales, R&D, and administration still overwhelm the model. That is a commercialization and scale problem, not a manufacturing problem, and it is the main reason I stay cautious.
Valuation
BFLY — Valuation Multiples
| Metric | Value |
|---|---|
| Current Share Price (USD) | 6.4 |
| Market Cap (USD Mil) | 1,709 |
| Enterprise Value (USD Mil) | 1,605 |
| Trailing P/E | — |
| Forward P/E | -94.7 |
| Price/Sales (TTM) | 13.9 |
| Price/Book (mrq) | 9.3 |
| EV/Revenue | 13 |
| EV/EBITDA | -38.5 |
| Beta (5Y Monthly) | 2.04 |
| FCF Yield % (TTM) | -0.4% |
| Forward EPS (USD) | -0.1 |
| Analyst Target Price – Low (USD) | 10 |
| Analyst Target Price – Mean (USD) | 11.2 |
| Analyst Target Price – High (USD) | 15 |
| # Analyst Opinions | 6 |
Source: Yahoo Finance
Butterfly trades at 13.0x EV/revenue and 13.9x price/sales, with a negative 0.4% FCF yield and a forward P/E of -94.7x. In my view, that is a demanding setup for a company with a -33.8% EBITDA margin and negative free cash flow, because the stock already prices in a much cleaner path to scale than the current cash generation supports. On the analysis here, I would put fair value in a range of roughly $0.4-$1.3 per share using a peer EV/revenue framework, which sits well below the 11.2 analyst mean target and even below the 10 low target; that gap tells me the consensus is giving much more credit to margin recovery than I am. Forward EPS is -0.0675 for Butterfly, versus positive forward EPS for the profitable peers, so the company is still being valued on a future earnings bridge that has not yet been built. I would need to see that bridge start to form in the operating margin before I would accept the current multiple as justified.
Leverage
BFLY — Leverage & Coverage (Quarterly)
| Metric | Value |
|---|---|
| Total Debt/Equity % (mrq) | 10 |
| Current Ratio (mrq) | 3.6 |
| Total Debt (mrq, USD Mil) | 18.4 |
| Operating Cash Flow (TTM, USD Mil) | -23.4 |
| Levered Free Cash Flow (TTM, USD Mil) | -7 |
| Net Debt/EBITDA (TTM) | 2.5 |
| FCF Margin % (TTM) | -5.7% |
Source: Yahoo Finance — Quarterly Financial Statements
Total debt was 18.4M mrq and debt/equity was 10.0%, while the current ratio was 3.6x and total cash was 122.3M. That gives Butterfly a liquidity cushion, but operating cash flow was -23.4M TTM and levered free cash flow was -7.0M TTM, so the balance sheet is a buffer rather than a source of value. Net debt/EBITDA was 2.5x and FCF margin was -5.7%, which means the company is not overlevered today, but it is still burning cash. I read that as manageable near-term funding risk, not a balance-sheet strength that changes the equity case.
Insider Activity
The insider record is one-sided selling: 20 open-market sales and no open-market purchases across the period shown. The selling is broad, with the CEO, Chief Business Officer, CAO and SVP of Finance, and Deputy General Counsel all participating, so I view it as weak insider alignment at the margin. That does not prove the business is deteriorating, but it does not give me confidence that management sees the current share price as cheap.
Comparable Analysis
LF0 has published standalone analyses of these peers: Boston Scientific (BSX) (rated Hold).
Growth
| Company | Revenue TTM (USD Mil) | Revenue Growth YoY % | EBITDA TTM (USD Mil) | Diluted EPS TTM |
|---|---|---|---|---|
| BFLY | 123.2 | 51.7% | -41.6 | -0.2 |
| GEHC | 21,637 | 7.2% | 3,597 | 4.7 |
| PHG | 17,665 | 0.5% | 2,416 | 1.3 |
| NNOX | 15.6 | 36.7% | -50 | -1.7 |
| FUJIF | 3,433,980 | 10.3% | 508,043 | 1.4 |
| BSX | 21,070 | 1.4% | 5,694 | 2.4 |
Source: Yahoo Finance
BFLY’s revenue growth of 51.7% TTM is faster than GEHC at 7.2%, PHG at 0.5%, and BSX at 1.4%, and it also exceeds FUJIF’s 10.3% while trailing only NNOX’s 36.7% among the smaller names. The catch is scale: BFLY still generated only $123.2M of revenue TTM and -$41.6M of EBITDA, so the growth premium only works if it keeps translating into operating leverage.
Valuation
| Company | Current Share Price (USD) | Trailing P/E | Forward P/E | EV/Revenue | EV/EBITDA | Price/Sales (TTM) | Price/Book (mrq) | Market Cap (USD Mil) | Enterprise Value (USD Mil) | Beta (5Y Monthly) | FCF Yield % (TTM) | Forward EPS | Analyst Target Price – Low | Analyst Target Price – Mean | Analyst Target Price – High | # Analyst Opinions |
|---|---|---|---|---|---|---|---|---|---|---|---|---|---|---|---|---|
| BFLY | 6.4 | — | -94.7 | 13 | -38.5 | 13.9 | 9.3 | 1,709 | 1,605 | 2.04 | -0.4% | -0.1 | 10 | 11.2 | 15 | 6 |
| GEHC | 76.6 | 16.2 | 14 | 2 | 11.8 | 1.6 | 3 | 34,620 | 42,452 | 0.85 | 5.3% | 5.5 | 73 | 87.5 | 100 | 20 |
| PHG | 26.9 | 20.1 | 14.2 | 1.8 | 13.3 | 1.5 | 2 | 26,312 | 32,017 | 0.92 | 5.8% | 1.9 | 26.2 | 32 | 41 | 5 |
| NNOX | 0.3 | — | -0.8 | 0.2 | — | 1.7 | 0.3 | 26 | 3 | 1.26 | -118.5% | -0.4 | 3 | 4.1 | 5 | 3 |
| FUJIF | 21.5 | 15.4 | — | 0.3 | 1.9 | 0 | 1 | 25,714 | 990,483 | 0.39 | -1,041.5% | — | — | — | — | — |
| BSX | 42 | 17.7 | 13.3 | 3.5 | 12.8 | 2.9 | 2.4 | 60,839 | 73,166 | 0.57 | — | 3.2 | 41 | 50 | 65 | 28 |
Source: Yahoo Finance
BFLY trades at 13.0x EV/revenue and 13.9x price/sales, while GEHC is at 2.0x and 1.6x, PHG at 1.8x and 1.5x, and BSX at 3.5x and 2.9x. That spread is hard to justify on current fundamentals, especially with BFLY’s -0.4% FCF yield and negative forward EPS, and it looks even richer when I compare it with the profitable peers’ stronger cash conversion. The stock’s 119.6% one-year return also stands out, so the market has already paid up for a recovery that still needs to show up in earnings.
Profitability
| Company | Operating Margin (TTM) | Net Margin (TTM) | Return on Assets (TTM) | Return on Equity (TTM) | Gross Margin (TTM) | EBITDA Margin (TTM) |
|---|---|---|---|---|---|---|
| BFLY | -29.2% | -43.6% | -9.6% | -27.7% | 70.3% | -33.8% |
| GEHC | 15.3% | 10.0% | 5.0% | 20.0% | 39.3% | 16.6% |
| PHG | 14.0% | 6.3% | 4.1% | 10.2% | 45.9% | 13.7% |
| NNOX | -355.3% | 0.0% | -27.9% | -99.0% | -77.2% | -319.5% |
| FUJIF | 6.2% | 7.6% | 3.5% | 7.1% | 40.2% | 14.8% |
| BSX | 20.2% | 16.6% | — | 14.3% | 68.6% | 27.0% |
Source: Yahoo Finance
BFLY’s gross margin of 70.3% is competitive with BSX at 68.6% and well above GEHC at 39.3% and PHG at 45.9%, but its operating margin of -29.3%, EBITDA margin of -33.8%, and net margin of -43.6% are far weaker than the profitable peers. GEHC posts 15.3% operating margin and 16.6% EBITDA margin, PHG posts 14.0% and 13.7%, and BSX posts 20.2% and 27.0%, which tells me BFLY’s issue is overhead absorption, not product gross economics. The moat described above is visible at the gross margin line, but it has not yet translated into peer-level earnings power.
Leverage
| Company | Total Debt/Equity % (mrq) | Current Ratio (mrq) | Total Debt (mrq, USD Mil) | Operating Cash Flow TTM (USD Mil) | Free Cash Flow TTM (USD Mil) | Net Debt/EBITDA (TTM) | FCF Margin % (TTM) |
|---|---|---|---|---|---|---|---|
| BFLY | 10 | 3.6 | 18.4 | -23.4 | -7 | 2.5 | -5.7% |
| GEHC | 87.7 | 1.3 | 10,407 | 2,415 | 1,831.1 | 2.1 | 8.5% |
| PHG | 65 | 1.3 | 7,465 | 2,282 | 1,527.5 | 2.3 | 8.6% |
| NNOX | 10.7 | 2.8 | 7.7 | -46.7 | -30.8 | 0.5 | -197.0% |
| FUJIF | 28.4 | 1.4 | 1,110,362.9 | 408,090 | -267,819 | 1.9 | -7.8% |
| BSX | 50.2 | — | 12,624 | — | — | 2.1 | — |
Source: Yahoo Finance
BFLY’s debt/equity of 10.0% and current ratio of 3.6x compare favorably with GEHC at 87.7% and 1.3x, PHG at 65.0% and 1.3x, and BSX at 50.2%. That lower leverage helps explain why BFLY can still fund losses, but it does not offset the fact that free cash flow remains negative at -7M TTM while GEHC and PHG are both positive. In other words, the balance sheet is safer than the income statement, and that is why the stock still deserves a discount to the profitable peers despite its faster growth.
Conclusion
I would put my rating as a Strong Sell because the market is already paying for a margin recovery that the financials have not yet delivered. The key tension is simple: revenue has improved to 32.6M in Q3 2026 and gross margin is healthy at 70.3%, but operating margin is still -29.3% and free cash flow remains negative, so the business is not yet converting its technology edge into shareholder value.
I would raise my rating toward a Hold if revenue can stay above 32M for two more quarters and operating margin moves materially closer to breakeven, because that would show the current run rate is durable and that overhead is finally being absorbed. If software and services remain at 35.0% of revenue or higher while gross margin stays near 70%, I would also see a better case for multiple support, since that would make the mix shift look like real operating leverage rather than a temporary hardware rebound.
I would move further toward a Sell if quarterly revenue slips back below 26.5M, which was the Q1 2026 level and would suggest the recent stabilization has not stuck, or if operating cash flow stays negative and the current ratio starts to fall from 3.6x. A second leg down in revenue would also make the -5.7% FCF margin look less like a temporary investment phase and more like a business that still cannot fund its own commercialization.
For now, I think the burden of proof still sits with the bull case because the stock has already rerated hard while the income statement has not caught up. The shares can work from here only if Butterfly turns the current revenue plateau into positive operating leverage, and I do not think that has happened yet.
What to Watch Next
- Revenue above 32M for two more quarters — would support a move toward Hold.
- Operating margin moving closer to breakeven — would show overhead is being absorbed.
- Software and services staying at 35% of revenue or higher — would support a stronger mix shift.
- Quarterly revenue below 26.5M — would argue the recent stabilization has failed.
- Current ratio falling from 3.6x — would signal liquidity is starting to tighten.
What’s your take? I rated Butterfly Network (BFLY) STRONG SELL above — but the goal here is to get this right, not just to publish an opinion. What would you add to this analysis, or which risk or catalyst do you think I’m under- or over-weighting? Tell me in the comments.
Our track record: every directional call is tracked publicly on The Scorecard, and Stocks Covered lists every company we have rated and when.
Sources
- SEC 10-K Annual Report — filed 2026-02-27
- SEC 8-K Filing (2026-05-08)
- SEC 8-K Filing (2026-04-30)
- SEC 8-K Filing (2026-02-26)
- SEC 8-K Filing (2026-01-14)
- SEC 8-K Filing (2026-01-12)
- SEC Form 4 Insider Transaction (2026-06-04)
- SEC Form 4 Insider Transaction (2026-05-21)
- SEC Form 4 Insider Transaction (2026-05-05)
- SEC 10-K Annual Report — FY2026
- SEC 10-K Annual Report — FY2025
- SEC 10-K Annual Report — FY2024
- SEC 10-K Annual Report — FY2023
- SEC 10-K Annual Report — FY2022
Data sourced from Yahoo Finance and SEC EDGAR. Not investment advice.
Leave a Comment