Executive Summary
Can a simple, volatility-scaled breakout model capture persistent trends across gold, bonds, commodities, and the U.S. dollar without relying on equity-market direction? This run covers 2010-01-01 to 2026-01-01 using quantstrat in R, with initial equity of $100,000. I compare it with buy-and-hold, apply base friction, and run a first sequence <span class="lf0-tooltip" tabindex="0" style="border-bottom: 1px dotted currentColor; cursor: help;" title="A deliberate check that makes assumptions harsher to see whether the result survives outside ideal conditions." data-tooltip="A deliberate check that makes assumptions harsher to see whether the result survives outside ideal conditions." aria-label="stress test: A deliberate check that makes assumptions harsher to see whether the result survives outside ideal conditions.">stress test</span>.
Research Card
| Field | Detail |
|---|---|
| Instrument | GLD, TLT, DBC, UUP |
| Strategy type | Diversified trend following / Donchian breakout |
| Publication archetype | transparent cross-asset replication and robustness study |
| Test period | 2010-01-01 to 2026-01-01 |
| Engine | quantstrat in R |
| Starting equity | $100,000 |
| Strategy net P&L | $18,878 |
| Strategy <span class="lf0-tooltip" tabindex="0" style="border-bottom: 1px dotted currentColor; cursor: help;" title="Compound annual growth rate. It converts the full-period return into an annualized growth pace." data-tooltip="Compound annual growth rate. It converts the full-period return into an annualized growth pace." aria-label="CAGR: Compound annual growth rate. It converts the full-period return into an annualized growth pace.">CAGR</span> | 1.09% |
| Strategy max <span class="lf0-tooltip" tabindex="0" style="border-bottom: 1px dotted currentColor; cursor: help;" title="The fall from a prior equity high to a later low. It measures the pain a trader had to sit through." data-tooltip="The fall from a prior equity high to a later low. It measures the pain a trader had to sit through." aria-label="drawdown: The fall from a prior equity high to a later low. It measures the pain a trader had to sit through.">drawdown</span> | -17.46% |
| Trades | 87 |
| <span class="lf0-tooltip" tabindex="0" style="border-bottom: 1px dotted currentColor; cursor: help;" title="The comparison hurdle. For a single ETF strategy, buy-and-hold of the same ETF is the first test to beat." data-tooltip="The comparison hurdle. For a single ETF strategy, buy-and-hold of the same ETF is the first test to beat." aria-label="Benchmark: The comparison hurdle. For a single ETF strategy, buy-and-hold of the same ETF is the first test to beat.">Benchmark</span> | Buy and hold GLD |
| Benchmark CAGR | 8.35% |
| CAGR spread | -7.27% |
| Costs/stress | Base friction and <span class="lf0-tooltip" tabindex="0" style="border-bottom: 1px dotted currentColor; cursor: help;" title="A simulation method that repeatedly reshuffles the same historical trades to see how much the sequence alone changes the path." data-tooltip="A simulation method that repeatedly reshuffles the same historical trades to see how much the sequence alone changes the path." aria-label="Monte Carlo: A simulation method that repeatedly reshuffles the same historical trades to see how much the sequence alone changes the path.">Monte Carlo</span> sequence stress included |
| Verdict | Trailed buy-and-hold on CAGR before costs |
The Setup
The counter-narrative here is that some ETFs don’t reward constant attention so much as they reward waiting for a clean break and then staying with it. My hypothesis is that a long-only trend filter can work across very different macro exposures-gold, duration, commodities, and the dollar-because each can spend long stretches in persistent regimes driven by policy cycles, inflation shocks, or flight-to-quality flows.
Results
| Metric | Strategy | Benchmark | Why it matters |
|---|---|---|---|
| Final Equity | $118,878 | $360,938 | Ending account value before full friction modeling. |
| CAGR | 1.09% | 8.35% | Annualized growth; the first hurdle is buy-and-hold. |
| Max Drawdown | -17.46% | -45.56% | Worst peak-to-trough decline. |
| <span class="lf0-tooltip" tabindex="0" style="border-bottom: 1px dotted currentColor; cursor: help;" title="Return per unit of volatility. It asks whether the strategy was paid enough for the ride it took." data-tooltip="Return per unit of volatility. It asks whether the strategy was paid enough for the ride it took." aria-label="Sharpe Ratio: Return per unit of volatility. It asks whether the strategy was paid enough for the ride it took.">Sharpe Ratio</span> | 1.90 | 0.59 | Return earned per unit of volatility. |
| <span class="lf0-tooltip" tabindex="0" style="border-bottom: 1px dotted currentColor; cursor: help;" title="Like Sharpe, but it only penalizes downside volatility, which is often what traders actually care about." data-tooltip="Like Sharpe, but it only penalizes downside volatility, which is often what traders actually care about." aria-label="Sortino Ratio: Like Sharpe, but it only penalizes downside volatility, which is often what traders actually care about.">Sortino Ratio</span> | 0.21 | 0.80 | Like Sharpe, but focused on downside volatility. |
| <span class="lf0-tooltip" tabindex="0" style="border-bottom: 1px dotted currentColor; cursor: help;" title="Annualized return divided by maximum drawdown. It asks how much growth the strategy earned for the pain it caused." data-tooltip="Annualized return divided by maximum drawdown. It asks how much growth the strategy earned for the pain it caused." aria-label="Calmar Ratio: Annualized return divided by maximum drawdown. It asks how much growth the strategy earned for the pain it caused.">Calmar Ratio</span> | 0.06 | N/A | CAGR divided by max drawdown. |
| <span class="lf0-tooltip" tabindex="0" style="border-bottom: 1px dotted currentColor; cursor: help;" title="Gross profits divided by gross losses. Above 1 means winners outweighed losers before considering other constraints." data-tooltip="Gross profits divided by gross losses. Above 1 means winners outweighed losers before considering other constraints." aria-label="Profit Factor: Gross profits divided by gross losses. Above 1 means winners outweighed losers before considering other constraints.">Profit Factor</span> | 1.14 | N/A | Gross profits divided by gross losses. |
| <span class="lf0-tooltip" tabindex="0" style="border-bottom: 1px dotted currentColor; cursor: help;" title="Average winning trade divided by average losing trade. It shows whether wins are large enough to pay for losses." data-tooltip="Average winning trade divided by average losing trade. It shows whether wins are large enough to pay for losses." aria-label="Payoff Ratio: Average winning trade divided by average losing trade. It shows whether wins are large enough to pay for losses.">Payoff Ratio</span> | 1.71 | N/A | Average winner divided by average loser. |
| Median Trade | $-105 | N/A | A reality check against a few outsized trades. |
| <span class="lf0-tooltip" tabindex="0" style="border-bottom: 1px dotted currentColor; cursor: help;" title="The share of the test period where capital was actually in the market. Lower exposure can change how returns should be judged." data-tooltip="The share of the test period where capital was actually in the market. Lower exposure can change how returns should be judged." aria-label="Exposure: The share of the test period where capital was actually in the market. Lower exposure can change how returns should be judged.">Exposure</span> | 64.39% | 100.00% | Percentage of days with capital at risk. |
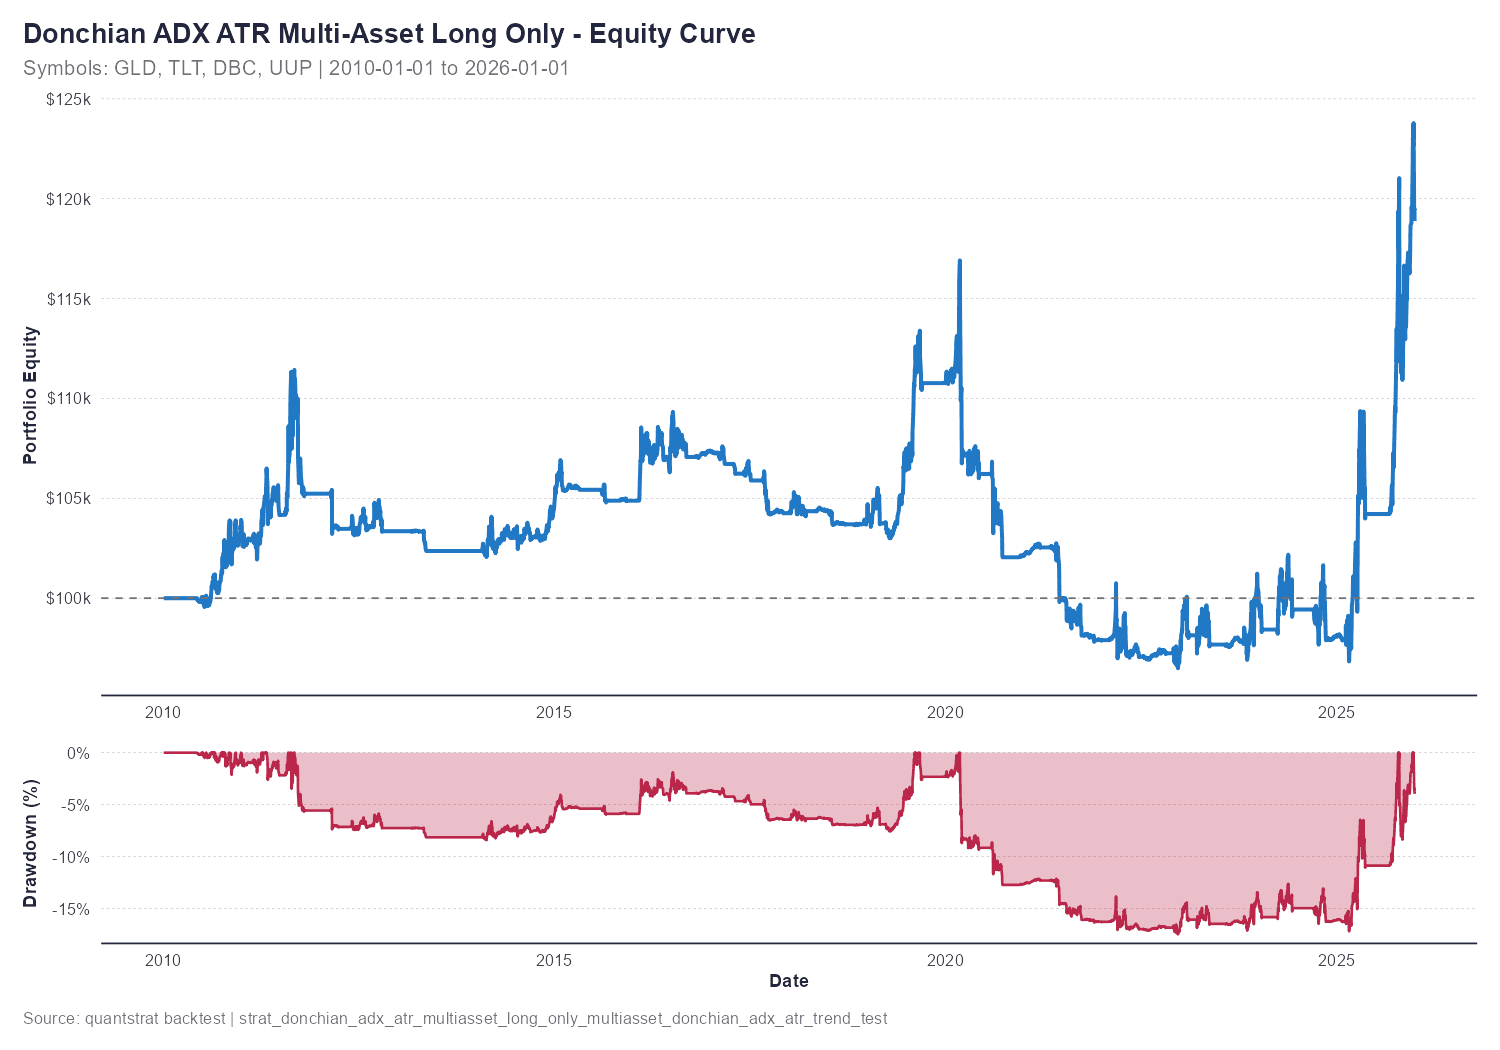
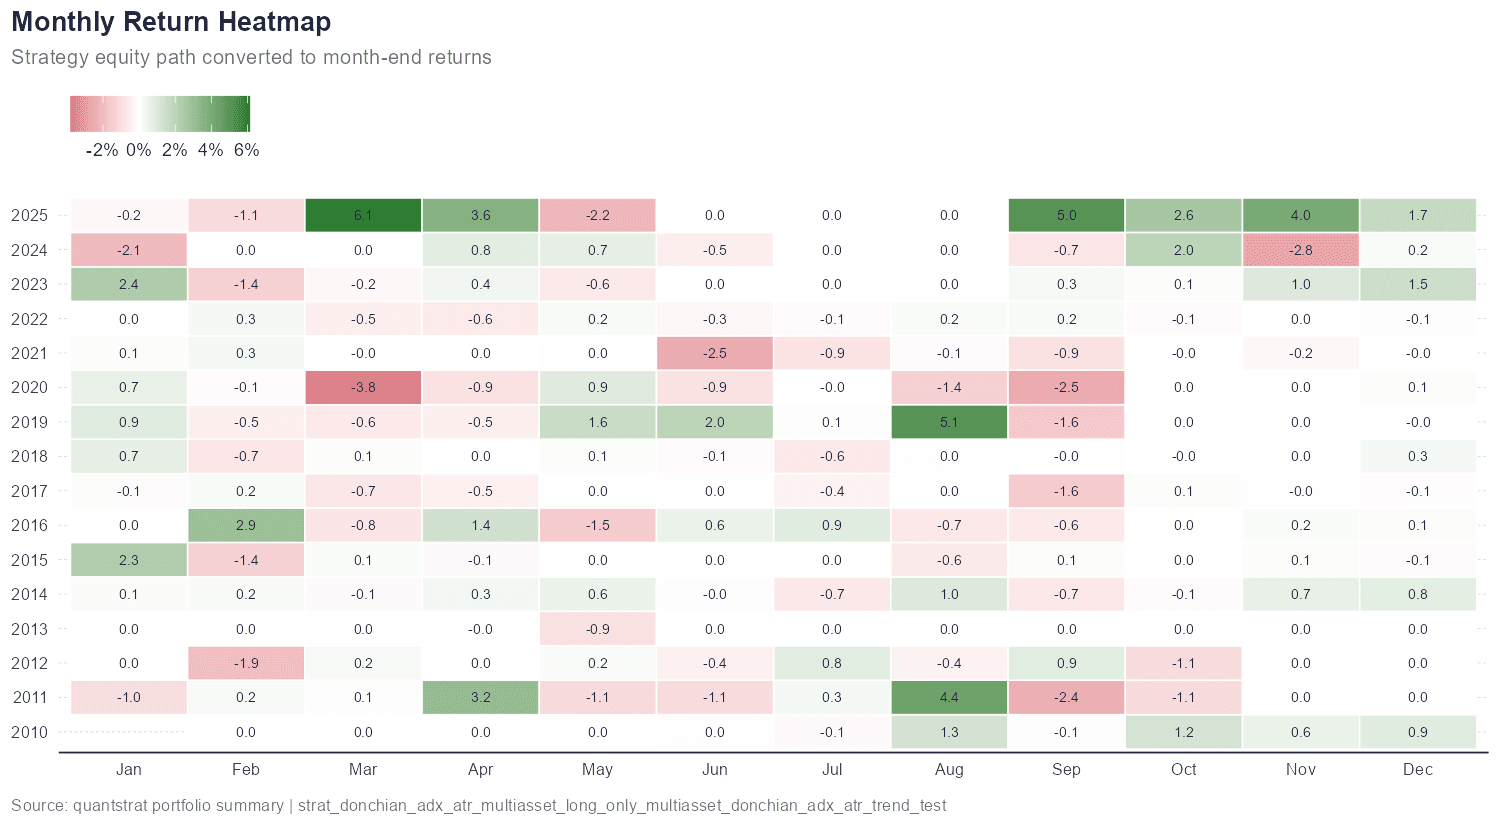
The backtest only weakly supported my original hypothesis. Final equity was $118,877.74 on $100,000 start, with net P&L of $18,877.74 and CAGR of 1.09%, so the return story is modest at best.
Statistical Limits And Regime Dependence
The key question is whether the evidence survives sampling uncertainty, clustered trades, and regime shifts. P-values are diagnostics, not trading signals.
| Statistical Check | Evidence | Why it matters |
|---|---|---|
| Bootstrap mean trade P&L | $-44.56 to $207.26 95% interval | Tests whether the <span class="lf0-tooltip" tabindex="0" style="border-bottom: 1px dotted currentColor; cursor: help;" title="The typical profit or loss per closed trade. Small values are fragile because costs can erase them quickly." data-tooltip="The typical profit or loss per closed trade. Small values are fragile because costs can erase them quickly." aria-label="average trade: The typical profit or loss per closed trade. Small values are fragile because costs can erase them quickly.">average trade</span> edge survives resampling. |
| Bootstrap mean positive rate | 84.3% | Useful for direction, but not a substitute for <span class="lf0-tooltip" tabindex="0" style="border-bottom: 1px dotted currentColor; cursor: help;" title="The later portion of the historical test, used here to check whether the result held up after the initial sample." data-tooltip="The later portion of the historical test, used here to check whether the result held up after the initial sample." aria-label="out-of-sample: The later portion of the historical test, used here to check whether the result held up after the initial sample.">out-of-sample</span> proof. |
| Binomial win-rate diagnostic | p=0.6476 | Checks whether the hit rate is unusual versus a neutral 50% baseline. |
| Wilcoxon trade-P&L diagnostic | p=0.7628 | Non-parametric check of whether trade P&L is centered above zero. |
| Equity-return serial dependence | p=0.0000 | Flags whether daily strategy returns are path-dependent. |
| Closed-trade serial dependence | p=N/A | Checks whether trade outcomes cluster. |
| Analysis Area | Status | Artifact |
|---|---|---|
| trade_edge | limited | statistical_diagnostics.rds/per_trade_stats.rds |
| win_rate | limited | statistical_diagnostics.rds/per_trade_stats.rds |
| path_risk | limited | stress_summary.rds |
| cost_sensitivity | ready | friction_summary.rds |
| parameter_robustness | missing | parameter_sensitivity.rds |
| sample_split | limited | stress_summary.rds |
| walk_forward | missing | walk_forward_summary.rds |
| serial_dependence | ready | statistical_diagnostics.rds |
Regime dependency: this setup can degrade when volatility expands, gaps dominate, or the sector enters a persistent trend. The in-sample/out-of-sample split further down tests stability, not parameter-optimization skill.
Costs And Stress Test
I now run a simple friction pass before drafting the article. For this strategy test, the base case assumes 3.00 bps of <span class="lf0-tooltip" tabindex="0" style="border-bottom: 1px dotted currentColor; cursor: help;" title="The difference between the expected execution price and the actual fill. It usually gets worse in fast or illiquid markets." data-tooltip="The difference between the expected execution price and the actual fill. It usually gets worse in fast or illiquid markets." aria-label="slippage: The difference between the expected execution price and the actual fill. It usually gets worse in fast or illiquid markets.">slippage</span> per side and 1.00 bps of spread cost per side, or 8.00 bps per round trip. That is still a model, but it is a better starting point than pretending fills are free.
| Friction Check | Value |
|---|---|
| Gross net P&L | $18,878 |
| Base <span class="lf0-tooltip" tabindex="0" style="border-bottom: 1px dotted currentColor; cursor: help;" title="The full entry-plus-exit trading cost for one completed trade, expressed here in basis points." data-tooltip="The full entry-plus-exit trading cost for one completed trade, expressed here in basis points." aria-label="round-trip cost: The full entry-plus-exit trading cost for one completed trade, expressed here in basis points.">round-trip cost</span> | $63 |
| <span class="lf0-tooltip" tabindex="0" style="border-bottom: 1px dotted currentColor; cursor: help;" title="Strategy profit after the friction model subtracts estimated spread, slippage, and commission costs." data-tooltip="Strategy profit after the friction model subtracts estimated spread, slippage, and commission costs." aria-label="Cost-adjusted net P&L: Strategy profit after the friction model subtracts estimated spread, slippage, and commission costs.">Cost-adjusted net P&L</span> | $1,174 |
| Gross profit factor | 1.14 |
| Cost-adjusted profit factor | 2.16 |
| <span class="lf0-tooltip" tabindex="0" style="border-bottom: 1px dotted currentColor; cursor: help;" title="The estimated round-trip cost level where the historical net profit would be fully consumed by trading costs." data-tooltip="The estimated round-trip cost level where the historical net profit would be fully consumed by trading costs." aria-label="Break-even round-trip cost: The estimated round-trip cost level where the historical net profit would be fully consumed by trading costs.">Break-even round-trip cost</span> | 2395.24 bps |
| Stress Check | Value |
|---|---|
| Monte Carlo simulations | 5000 |
| Observed trade-order max drawdown | -0.36% |
| <span class="lf0-tooltip" tabindex="0" style="border-bottom: 1px dotted currentColor; cursor: help;" title="A conservative drawdown estimate: only about 5% of reshuffled paths were worse than this level." data-tooltip="A conservative drawdown estimate: only about 5% of reshuffled paths were worse than this level." aria-label="95th percentile drawdown: A conservative drawdown estimate: only about 5% of reshuffled paths were worse than this level.">95th percentile drawdown</span> | -0.47% |
| Median simulated ending P&L | $1,096 |
| <span class="lf0-tooltip" tabindex="0" style="border-bottom: 1px dotted currentColor; cursor: help;" title="The low-end bootstrapped outcome. It asks what the strategy looked like when the sampled trades were less favorable than history." data-tooltip="The low-end bootstrapped outcome. It asks what the strategy looked like when the sampled trades were less favorable than history." aria-label="Weak-path ending P&L: The low-end bootstrapped outcome. It asks what the strategy looked like when the sampled trades were less favorable than history.">Weak-path ending P&L</span> | $-650 |
| High-cost net P&L | $1,111 |
| <span class="lf0-tooltip" tabindex="0" style="border-bottom: 1px dotted currentColor; cursor: help;" title="The earlier portion of the historical test, used here as a rough development-period diagnostic." data-tooltip="The earlier portion of the historical test, used here as a rough development-period diagnostic." aria-label="In-sample: The earlier portion of the historical test, used here as a rough development-period diagnostic.">In-sample</span> net P&L | $83 over 13 trades |
| Out-of-sample net P&L | $1,154 over 6 trades |
| Out-of-sample profit factor | 4.06 |
| In-sample avg trade / profit factor | $6.36 / 1.14 (13 trades) |
| Out-of-sample avg trade / profit factor | $192.31 / 4.06 (6 trades) |
| Walk-forward windows | Not available — rolling walk-forward needs at least 30 closed trades with dated windows; this run only produced 19 |
| <span class="lf0-tooltip" tabindex="0" style="border-bottom: 1px dotted currentColor; cursor: help;" title="A rerun grid that changes strategy settings to see whether the result survives nearby parameter choices." data-tooltip="A rerun grid that changes strategy settings to see whether the result survives nearby parameter choices." aria-label="Parameter sensitivity: A rerun grid that changes strategy settings to see whether the result survives nearby parameter choices.">Parameter sensitivity</span> | Pending rerun grid; Parameter sensitivity requires rerunning the strategy across a parameter grid; no rerun grid artifact is available for this saved backtest yet. |
Watch the break-even round-trip cost: above that level, the historical edge is gone. Monte Carlo separates edge from path luck; the in/out row is a chronological closed-trade split (first 70% of trades vs. the rest), not walk-forward optimization. The out-of-sample half looks stronger here, but with only 13 in-sample and 6 out-of-sample trades this is far too small a sample to read as a real improvement — it mainly shows that this particular split isn’t a red flag, not that the edge is confirmed.
What Breaks It
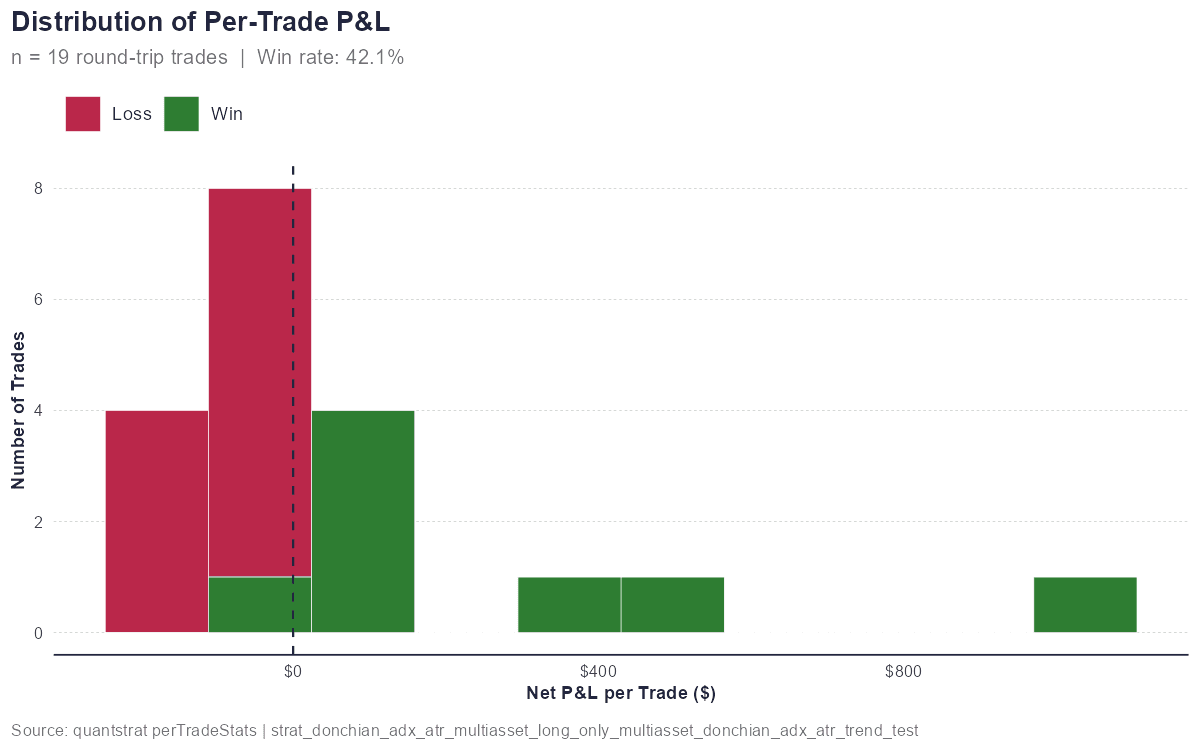
The trade P&L distribution is ugly in the way that matters: most trades cluster near flat to slightly negative, while a few outsized winners carry the whole result. Across all 87 trades, the median trade was -$105.03 and the <span class="lf0-tooltip" tabindex="0" style="border-bottom: 1px dotted currentColor; cursor: help;" title="The percentage of trades that made money. It only matters alongside payoff size and loss size." data-tooltip="The percentage of trades that made money. It only matters alongside payoff size and loss size." aria-label="win rate: The percentage of trades that made money. It only matters alongside payoff size and loss size.">win rate</span> was only 38.9%, so the typical trade lost money rather than paying for the losers — the result rests on a small number of large winners (the largest single winner made $6,336) offsetting a majority of small losses.
Trade Log
Verdict
I set out to test whether a simple long-only breakout system, filtered by trend strength and regime, could extract durable upside from a small set of macro ETFs without relying on constant participation.
What would change my mind: the same rule needs to survive costs while closing the gap versus buy-and-hold, or prove useful as a timing overlay rather than a standalone strategy.
R Notes
The reproducibility contract is the saved artifact set plus the R scripts that created it. The key JSON/RDS files are recorded in the frontmatter.
# Rebuild the evidence layer for one saved strategy output
source('backtesting_blog_posts/statistical_diagnostics.R')
source('backtesting_blog_posts/walk_forward_diagnostics.R')
source('backtesting_blog_posts/analysis_test_selector.R')

out_dir <- file.path('backtesting_blog_posts', 'outputs', 'strat_donchian_adx_atr_multiasset_long_only_multiasset_donchian_adx_atr_trend_test')
per_trade <- readRDS(file.path(out_dir, 'per_trade_stats.rds'))
portfolio <- readRDS(file.path(out_dir, 'portfolio_summary.rds'))

diagnostics <- build_statistical_diagnostics(per_trade, portfolio)
walk_forward <- build_walk_forward_summary(per_trade)
test_plan <- build_analysis_test_plan(out_dir)
For the current <span class="lf0-tooltip" tabindex="0" style="border-bottom: 1px dotted currentColor; cursor: help;" title="Percentage Bands, a band-style indicator that marks stretched prices relative to recent behavior." data-tooltip="Percentage Bands, a band-style indicator that marks stretched prices relative to recent behavior." aria-label="PBands: Percentage Bands, a band-style indicator that marks stretched prices relative to recent behavior.">PBands</span> series, parameter_sensitivity uses a deterministic next-bar rerun helper because native quantstrat parameter clones can fail to propagate osMaxPos limits safely. Future strategy families should call register_parameter_sensitivity_builder() with their own sensitivity builder.
Important: Backtests are simulations. Past performance of a simulated strategy does not guarantee future results. Results do not yet fully account for real-world factors including <span class="lf0-tooltip" tabindex="0" style="border-bottom: 1px dotted currentColor; cursor: help;" title="The gap between the price buyers bid and sellers ask. Crossing that gap is a real trading cost." data-tooltip="The gap between the price buyers bid and sellers ask. Crossing that gap is a real trading cost." aria-label="bid-ask spread: The gap between the price buyers bid and sellers ask. Crossing that gap is a real trading cost.">bid-ask spread</span>, market impact, borrow costs, or taxes. This is for educational purposes only and is not investment advice.
Leave a Comment