| Company | Jul 25 | Aug 25 | Sep 25 | Oct 25 | Nov 25 | Dec 25 | Jan 26 | Feb 26 | Mar 26 | Apr 26 | May 26 | Jun 26 | 12-Mo |
|---|---|---|---|---|---|---|---|---|---|---|---|---|---|
| FORM | -17% | +3% | +25% | +51% | +0% | +1% | +26% | +40% | -2% | +40% | -8% | +28% | +365% |
| TER | +19% | +10% | +17% | +32% | +0% | +6% | +25% | +33% | -7% | +16% | +9% | +29% | +439% |
| AMAT | -2% | -10% | +27% | +14% | +8% | +2% | +25% | +16% | -8% | +15% | +14% | +61% | +298% |
| KLAC | -2% | -1% | +24% | +12% | -3% | +3% | +18% | +7% | -3% | +19% | +10% | +57% | +239% |
| LRCX | -3% | +6% | +34% | +18% | -1% | +10% | +36% | +0% | -9% | +21% | +23% | +36% | +348% |
| ACLS | -3% | +18% | +22% | -19% | +4% | -3% | +10% | -6% | +13% | +49% | +8% | +26% | +172% |
Source: Yahoo Finance monthly adjusted close.
Executive Summary
Rating: HOLD | FORM
Measured from adjusted close on 2026-07-16 to 2026-10-14. Sell ratings are correct when the stock falls; Hold is tracked as a +/-10% range. Daily-close data, not intraday. Calls are tracked for 182 days from publication, then frozen as a final record.
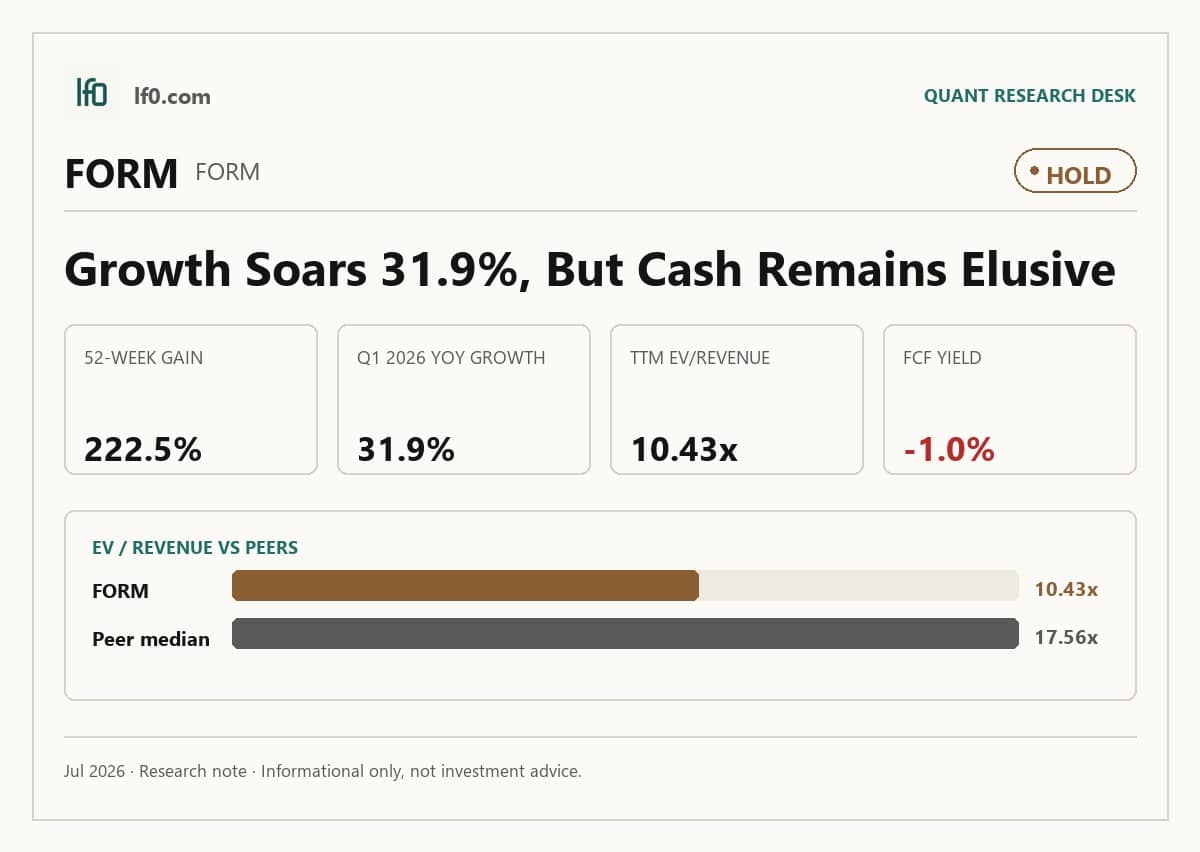
I would put my rating as a Hold because FormFactor is growing fast, but the stock already discounts a lot of that improvement and the latest quarter showed a margin reset rather than clean operating leverage. Revenue rose $226.1M year over year to $226.1M in Q1 2026, yet EBITDA fell to $32.9M from $44.4M in Q4 2025, so the key question is whether the company can turn AI-linked demand into steadier cash generation. I would move more towards a Buy if revenue growth stays above 25.0% for the next two quarters and levered free cash flow turns positive, meaning the business is funding growth without leaning on the balance sheet.
Company Profile
FormFactor, Inc., founded in 1993 and first shipping products in 1995, designs and sells electrical and optical test and measurement tools for the semiconductor lifecycle, from device characterization and design debug to qualification and production test. Revenue comes mainly from custom probe cards and analytical probes, plus probe stations, thermal systems, cryogenic systems, and services that help customers improve yield and reduce scrap. It operates in two segments, Probe Cards and Systems, and serves foundry, logic, DRAM, flash, display, sensor, and quantum computing customers. The company has expanded through acquisitions and continues to look for add-on deals. Its main manufacturing sites are in Livermore and Beaverton, with a Farmers Branch, Texas facility being built out for probe card production in late fiscal 2026. It is listed on Nasdaq under FORM and has a lightly levered balance sheet with $31.9M of debt and ample operating cash flow.
Economic Moat
Business Model
The custom probe card architecture is the most defensible part of FormFactor’s model because each card is built to a customer’s wafer layout and test requirements and must keep high-fidelity contact through hundreds of thousands, and even millions, of compression cycles. I feel that is hard for a well-funded competitor to replicate within 3 years because the company combines MEMS-based design, automated routing, millimeter-wave testing above 80 GHz, and customer-specific qualification work tied to the device under test rather than a generic catalog product. The same logic extends into analytical probes and probe stations, where FormFactor offers over 50 analytical probe models and highly configurable systems for temperatures from near absolute zero to hundreds of degrees centigrade, so the secondary moat is breadth across the lab-to-fab workflow rather than one product line alone. Its service and support layer also matters: applications engineers, on-site maintenance, and global repair capability make the installed base stickier, which means the business is not just selling hardware but embedding itself in customer test flows. That breadth is consistent with the 42.2% gross margin in the TTM profitability table, which tells me the moat is real but still not broad enough to deliver peer-leading operating leverage.
Business & Operating Risks
The biggest disclosed risk is customer concentration tied to probe card demand. According to the risk factors in their SEC 10-K, one customer represented 22.9% of fiscal 2025 revenue, two customers represented 33.5% of fiscal 2024 revenue, and one customer represented 17.1% of fiscal 2023 revenue, so a cancellation, deferral, or mix shift at even one account can move revenue and gross margin quickly because these are custom products with non-recoverable design costs and possible inventory impairment. Competition and technology substitution are the next major risks. The filing says increased competition can lead to price reductions, reduced gross margins, or loss of market share, and names threats from existing competitors, new test equipment manufacturers, and semiconductor makers that may increase test throughput, reduce test content, or change their test procedures. That is not generic boilerplate for FormFactor, because the company depends on probe cards for the substantial majority of revenue, so any shift toward fewer probe cards per wafer would hit the core revenue engine and likely pressure margins before management can offset it with new products. Execution risk around the Farmers Branch, Texas manufacturing site is newly more important. According to their SEC filings, the site was purchased in June 2025 and is expected to begin ramping late in the fourth quarter of fiscal 2026, with risks including construction delays, equipment installation issues, qualification delays, and lower-than-planned yields or cost targets. The concentration and ramp risks do not break the moat, but they do threaten the very managed-capacity and customer-specific manufacturing advantage that supports it.
Management Discussion & Analysis
Management is responding to the risks above, but not all of them are solved. The company bought Keystone Photonics in December 2025, bought a 20% equity interest in FICT Limited in February 2025, and purchased the Farmers Branch, Texas site in June 2025, so capital is being directed toward AI infrastructure, silicon photonics, and future capacity. At the same time, cash and cash equivalents plus marketable securities fell to $275.2M at December 27, 2025 from $360M at December 28, 2024, which tells me the growth plan is being funded with balance-sheet capacity rather than self-funding alone. Management also adopted restructuring plans on January 5, 2026 to consolidate Carlsbad and Baldwin Park manufacturing, which is a direct response to cost pressure and should help gross margin over time, even though factory start-up costs were $3M in fiscal 2025 and are expected to be $20M to $25M in fiscal 2026 before the new site contributes revenue. The new $150M revolving credit facility, which matures on July 29, 2030 and had no borrowings outstanding at December 27, 2025, improves liquidity flexibility, but I would not read it as a sign that leverage is the main story here. Management is acting on the execution risk, yet the margin drag from the ramp means the response is still in progress rather than complete.
Recent Events
The most important recent development is the January 5, 2026 restructuring plan to consolidate the Carlsbad and Baldwin Park manufacturing sites, which should better align capacity with current demand and support gross margin improvement. The plan is not cosmetic: it covers roughly 200 to 300 employees and carries $30M to $40M of charges, so I read it as a deliberate reset of the cost base rather than a one-off cleanup. The May 15, 2026 annual meeting also added a more shareholder-friendly capital structure signal in the sense that management is trying to preserve technical talent, but the 5.0 million share increase to the 2012 Equity Incentive Plan is still dilutionary if execution does not improve. I also note the February 13, 2026 director departure, with Kevin Brewer choosing not to stand for re-election, and the February 4 and April 29, 2026 earnings releases, which kept the market focused on operating execution rather than strategic change. Taken together, the recent events support the moat only modestly: they show management is trying to protect the manufacturing base, but they also confirm that the operating model is still being reworked.
Financial Analysis
Growth
FORM — Financial Growth (Quarterly, USD Mil)
| Metric | 2025-03-31 | 2025-06-30 | 2025-09-30 | 2025-12-31 | 2026-03-31 |
|---|---|---|---|---|---|
| REVENUE (USD Mil) | 171.4 | 195.8 | 202.7 | 215.2 | 226.1 |
| EBIT (USD Mil) | 3.3 | 12.3 | 19 | 35 | 23.7 |
| EBITDA (USD Mil) | 12.1 | 21.9 | 28.7 | 44.4 | 32.9 |
| NET INCOME (USD Mil) | 6.4 | 9.1 | 15.7 | 23.2 | 20.4 |
| DILUTED EPS | 0.1 | 0.1 | 0.2 | 0.3 | 0.3 |
Source: Yahoo Finance — Quarterly Financial Statements
Revenue rose from $171.4M in Q1 2025 to $226.1M in Q1 2026, a 31.9% increase, after moving from $195.8M in Q2 2025 to $202.7M in Q3 2025 and $215.2M in Q4 2025. EBITDA grew faster than sales in the first three quarters, but Q1 2026 EBITDA of $32.9M was down from $44.4M in Q4 2025, so the latest quarter shows a margin reset even as revenue kept climbing. The 2025 10-K ties the full-year record $785M revenue to AI-related high-bandwidth memory demand, which supports durability, but the Q4-to-Q1 EBITDA drop is the swing I would watch because it tells me growth is still uneven at the profit line. That matters for the moat too: the custom-test franchise is clearly winning business, but it has not yet translated into consistently stronger operating leverage.
Profitability
FORM — Profitability (TTM)
| Metric | TTM |
|---|---|
| Operating Margin (TTM) | 17.7% |
| Net Margin (TTM) | 8.1% |
| Return on Assets (TTM) | 5.2% |
| Return on Equity (TTM) | 6.8% |
| Gross Margin (TTM) | 42.2% |
| EBITDA Margin (TTM) | 16.4% |
Source: Yahoo Finance — Trailing Twelve Months (TTM)
TTM gross margin was 42.2%, operating margin was 17.7%, EBITDA margin was 16.4%, net margin was 8.14%, ROA was 5.15%, and ROE was 6.75%. The 24.5-point gap between gross and operating margin shows that FormFactor still carries a heavy operating expense load, so the business is not yet converting product gross profit into full operating leverage. The smaller spread between operating and EBITDA margin suggests depreciation and amortization are not the main issue; the bigger question is scale discipline in opex. ROE only modestly exceeds ROA, which means returns are not being amplified by aggressive leverage and are instead coming from the business itself. I would describe the margin stack as profitable but not yet elite, and the key watchpoint is whether operating margin keeps closing toward gross margin, because that would show the company is moving further toward durable profitability.
Valuation
FORM — Valuation Multiples
| Metric | Value |
|---|---|
| Market Cap (USD Mil) | 8,425 |
| Enterprise Value (USD Mil) | 8,757 |
| Trailing P/E | 124.2 |
| Forward P/E | 38.7 |
| Price/Sales (TTM) | 10 |
| Price/Book (mrq) | 8 |
| EV/Revenue | 10.4 |
| EV/EBITDA | 63.7 |
| Beta (5Y Monthly) | 1.22 |
| FCF Yield % (TTM) | -0.0% |
| Forward EPS (USD) | 2.8 |
| Analyst Target Price – Low (USD) | 64 |
| Analyst Target Price – Mean (USD) | 144.7 |
| Analyst Target Price – High (USD) | 175 |
| # Analyst Opinions | 9 |
Source: Yahoo Finance
FormFactor trades at 10.4x EV/Revenue, 10.0x Price/Sales, 124.0x trailing P/E, and 38.7x forward P/E, while FCF yield is -0.0% and beta is 1.2x. In my view, that valuation already assumes the company can hold onto AI-linked demand and improve cash conversion, because the current EBITDA margin of 16.4% and levered free cash flow of $0.6M do not yet justify a premium on cash generation. With 9 analyst opinions, the consensus target range is $64 to $175, with a $145 mean; on the analysis here, I would put fair value below that mean and closer to the lower half of the range because I weight cash conversion and the Q1 EBITDA reset more heavily than the consensus appears to. Using the company’s forward EPS of 2.79, the forward P/E implies the market is paying for a step-up in earnings that still has to be proven in cash terms, and that is why the stock looks more expensive than the headline growth rate alone would suggest. I would keep the valuation at a Hold because the multiple is not absurd, but it is demanding for a business that is still working through a margin reset and a costly capacity build-out.
Leverage
FORM — Leverage & Coverage (Quarterly)
| Metric | Value |
|---|---|
| Total Debt/Equity % (mrq) | 3 |
| Current Ratio (mrq) | 4.5 |
| Total Debt (mrq, USD Mil) | 31.9 |
| Operating Cash Flow (TTM, USD Mil) | 136.8 |
| Levered Free Cash Flow (TTM, USD Mil) | -0.6 |
| Net Debt/EBITDA (TTM) | -2 |
| FCF Margin % (TTM) | -0.1% |
Source: Yahoo Finance — Quarterly Financial Statements
Total debt was $31.89M, or 3.012% of equity, against a current ratio of 4.548x and net debt/EBITDA of -1.975x, so the balance sheet is lightly levered and near-term liquidity is ample. Operating cash flow was $136.8M TTM, while levered free cash flow was $0.567M and FCF margin was -0.07%, which tells me EBITDA is not yet converting cleanly into residual cash because capex and working capital are absorbing most of it. Net debt/EBITDA being negative means cash exceeds debt, so refinancing risk is low today, but the negative FCF also means flexibility depends on cash conversion improving rather than on leverage relief. I see the balance sheet as a support, not the thesis itself: it gives FormFactor room to fund the Farmers Branch build-out, but it does not by itself solve the cash-generation gap.
Insider Activity
The insider transaction record I see here is one-sided: 52 open-market sales and 0 open-market purchases over 2025-01-02 to 2026-06-02, so insiders are net sellers. The selling is broad rather than concentrated, with the CEO and multiple directors transacting, which points to weak insider alignment with shareholders at current prices. I would not overread the 0.713% insider ownership figure on its own, but the absence of open-market buying does not help the case when the stock is already priced for execution.
Comparable Analysis
Growth
| Company | Revenue TTM (USD Mil) | Revenue Growth YoY % | EBITDA TTM (USD Mil) | Diluted EPS TTM |
|---|---|---|---|---|
| FORM | 839.8 | 32.0% | 137.4 | 0.9 |
| TER | 3,786.8 | 87.0% | 1,161.5 | 5.4 |
| AMAT | 29,024 | 11.4% | 9,275 | 10.6 |
| KLAC | 13,096.7 | 11.5% | 5,850.2 | 3.5 |
| LRCX | 21,681.8 | 23.8% | 7,847.8 | 5.3 |
| ACLS | 845.4 | 3.3% | 108.2 | 3.2 |
Source: Yahoo Finance
FormFactor’s revenue grew 32.0% TTM, faster than ACLS at 3.3%, TER at 87.0%, AMAT at 11.4%, KLAC at 11.5%, and LRCX at 23.8%. That growth advantage is real, but FORM’s diluted EPS of 0.26 TTM is still well below AMAT at 10.6, KLAC at 3.5, and LRCX at 5.3, so the market is paying for a smaller company that is growing faster but still earning less per share. I think that is the right way to frame it: FORM has the better near-term growth rate, but the earnings base is still thin relative to the larger peers.
Valuation
| Company | Trailing P/E | Forward P/E | EV/Revenue | EV/EBITDA | Price/Sales (TTM) | Price/Book (mrq) | Market Cap (USD Mil) | Enterprise Value (USD Mil) | Beta (5Y Monthly) | FCF Yield % (TTM) | Forward EPS | Analyst Target Price – Low | Analyst Target Price – Mean | Analyst Target Price – High | # Analyst Opinions |
|---|---|---|---|---|---|---|---|---|---|---|---|---|---|---|---|
| FORM | 124.2 | 38.7 | 10.4 | 63.7 | 10 | 8 | 8,425 | 8,757 | 1.22 | -0.0% | 2.8 | 64 | 144.7 | 175 | 9 |
| TER | 60.2 | 33.1 | 14.1 | 46 | 13.5 | 16.2 | 50,944 | 53,393 | 1.74 | 0.6% | 9.8 | 270 | 423.4 | 550 | 17 |
| AMAT | 53.7 | 34 | 15.8 | 49.5 | 15.6 | 18.9 | 451,739 | 459,071 | 1.57 | 0.7% | 16.7 | 358 | 623.1 | 900 | 35 |
| KLAC | 62.6 | 43.1 | 22.5 | 50.3 | 22 | 49.4 | 287,968 | 294,446 | 1.41 | 1.0% | 5.1 | 150 | 232.4 | 325 | 28 |
| LRCX | 60.9 | 39.9 | 19.3 | 53.3 | 18.6 | 38.1 | 403,559 | 418,463 | 1.80 | 1.1% | 8.1 | 220 | 366.5 | 500 | 31 |
| ACLS | 43.7 | 29.1 | 4.9 | 38.5 | 5.1 | 4.1 | 4,329 | 4,161 | 1.87 | 1.1% | 4.8 | 156 | 169.7 | 180 | 3 |
Source: Yahoo Finance
FORM trades at 10.4x EV/Revenue and 38.7x forward P/E, versus TER at 14.1x and 33.1x, AMAT at 15.8x and 34.0x, KLAC at 22.5x and 43.1x, LRCX at 19.3x and 39.9x, and ACLS at 4.9x and 29.1x. FORM’s FCF yield is -0.0%, while TER, AMAT, KLAC, LRCX, and ACLS all post positive yields, so the stock is priced for earnings quality that has not yet converted into cash. On a peer-multiple basis, FORM looks cheaper than the larger equipment names on EV/Revenue, but that discount is partly explained by its weaker cash conversion and smaller margin profile, which is why I do not think the market is mispricing it by a wide margin. A $1 investment in FORM a year ago would be worth $2.31 today, versus $2.69 in TER, $1.93 in AMAT, $2.39 in KLAC, $2.34 in LRCX, and $1.02 in ACLS, so the stock has already rerated sharply and is no longer a simple catch-up trade.
Profitability
| Company | Operating Margin (TTM) | Net Margin (TTM) | Return on Assets (TTM) | Return on Equity (TTM) | Gross Margin (TTM) | EBITDA Margin (TTM) |
|---|---|---|---|---|---|---|
| FORM | 17.7% | 8.1% | 5.2% | 6.8% | 42.2% | 16.4% |
| TER | 37.6% | 22.6% | 15.8% | 28.7% | 58.7% | 30.7% |
| AMAT | 31.9% | 29.3% | 14.9% | 39.7% | 49.0% | 32.0% |
| KLAC | 41.2% | 35.7% | 21.3% | 95.0% | 61.5% | 44.7% |
| LRCX | 35.0% | 30.9% | 22.8% | 66.8% | 50.0% | 36.2% |
| ACLS | 4.0% | 11.9% | 4.5% | 9.7% | 43.6% | 12.8% |
Source: Yahoo Finance
FORM’s gross margin of 42.2%, EBITDA margin of 16.4%, operating margin of 17.7%, and net margin of 8.14% all sit below TER’s 58.7%, 30.7%, 37.6%, and 22.6%, below KLAC’s 61.5%, 44.7%, 41.2%, and 35.7%, and below LRCX’s 50.0%, 36.2%, 35.0%, and 30.9%. The gap looks more like scale and cost structure than a broken model, because FORM’s margins are closer to ACLS’s 43.6% gross margin and 12.8% EBITDA margin than to the larger peers, which means investors should treat FORM as a smaller, less efficient operator rather than a structurally inferior one. Returns are also lower: FORM’s ROE is 6.75% and ROA is 5.15%, versus TER at 28.7% and 15.8%, KLAC at 95.0% and 21.3%, and LRCX at 66.8% and 22.8%.
Leverage
| Company | Total Debt/Equity % (mrq) | Current Ratio (mrq) | Total Debt (mrq, USD Mil) | Operating Cash Flow TTM (USD Mil) | Free Cash Flow TTM (USD Mil) | Net Debt/EBITDA (TTM) | FCF Margin % (TTM) |
|---|---|---|---|---|---|---|---|
| FORM | 3 | 4.5 | 31.9 | 136.8 | -0.6 | -2 | -0.1% |
| TER | 2.6 | 2.1 | 82.4 | 777.9 | 298.3 | -0.1 | 7.9% |
| AMAT | 30.4 | 2.5 | 7,268 | 7,993 | 3,040.4 | -0.1 | 10.5% |
| KLAC | 105.4 | 3 | 6,145.4 | 4,401.6 | 2,890.2 | 0.2 | 22.1% |
| LRCX | 35.3 | 2.5 | 3,734.5 | 6,954.6 | 4,352.3 | -0.1 | 20.1% |
| ACLS | 6.7 | 4.6 | 70.5 | 96.7 | 49.1 | -2.7 | 5.8% |
Source: Yahoo Finance
FORM’s total debt to equity is only 3.012%, current ratio is 4.548x, net debt to EBITDA is -1.975x, and free cash flow margin is -0.07%, versus TER at 2.6% debt to equity and -0.1x net debt to EBITDA, AMAT at 30.4% and -0.1x, KLAC at 105.4% and 0.2x, LRCX at 35.3% and -0.1x, and ACLS at 6.7% and -2.7x. The cash-rich balance sheet, with $303.3M of cash, gives FORM more flexibility than the higher-debt peers, but the near-zero FCF margin says that flexibility is not yet being monetized for shareholders. In other words, the balance sheet is a cushion, not a catalyst, and the market is still waiting for cash conversion to catch up with the growth rate.
Conclusion
I would put my rating as a Hold because the core tension is between strong revenue growth and weak cash conversion. FormFactor’s 31.9% year-over-year revenue growth in Q1 2026 is real, but EBITDA fell to $32.9M from $44.4M in Q4 2025, and levered free cash flow was still negative at $0.567M TTM, so the latest numbers do not yet show that the growth is turning into durable earnings power. The balance sheet gives the company room to execute, with $31.9M of debt against $303.3M of cash, but that cushion matters only if the Farmers Branch ramp and the restructuring plan actually improve margins.
I would raise my rating more towards a Buy if revenue growth stays above 25.0% for the next two quarters, meaning the AI and high-bandwidth memory demand call is still broadening rather than peaking, and if levered free cash flow turns positive on a sustained basis. On the current $226.1M Q1 2026 revenue base, a move in EBITDA margin from 16.4% to 20.0% would add roughly $8.1M of quarterly EBITDA, which would materially improve the cash conversion profile and make the current multiple easier to defend. I would also want to see gross margin hold above 42.2%, because that would tell me the restructuring and site consolidation are helping rather than just offsetting inflation and start-up costs.
The bear case is that the Q1 2026 EBITDA drop to $32.9M from $44.4M proves the latest quarter was a margin reset rather than a temporary pause, while the Farmers Branch ramp adds $20M to $25M of start-up cost in fiscal 2026 before it contributes revenue. If customer concentration also bites, with one account still at 22.9% of fiscal 2025 revenue, a single order delay could hit both sales and gross margin in the same quarter, which would make the current valuation look stretched very quickly. That is the risk I would watch most closely, because it would show up first in margins and then in cash flow.
Weighing both sides, I lean to Hold rather than Buy because the bull case depends on cash flow catching up to growth, and that has not happened yet. The stock can work if execution stays clean, but I would want to see one more quarter of positive free cash flow and no slippage in the manufacturing ramp before becoming more constructive.
What’s your take? I rated FormFactor (FORM) HOLD above — but the goal here is to get this right, not just to publish an opinion. What would you add to this analysis, or which risk or catalyst do you think I’m under- or over-weighting? Tell me in the comments.
Sources
- SEC 10-K Annual Report — filed 2026-02-20
- SEC 8-K Filing (2026-05-19)
- SEC 8-K Filing (2026-04-29)
- SEC 8-K Filing (2026-02-18)
- SEC 8-K Filing (2026-02-04)
- SEC 8-K Filing (2026-01-09)
- SEC Form 4 Insider Transaction (2026-06-04)
- SEC Form 4 Insider Transaction (2026-06-04)
- SEC Form 4 Insider Transaction (2026-05-22)
- SEC 10-K Annual Report — FY2026
- SEC 10-K Annual Report — FY2025
- SEC 10-K Annual Report — FY2024
- SEC 10-K Annual Report — FY2023
- SEC 10-K Annual Report — FY2022
Data sourced from Yahoo Finance and SEC EDGAR. Not investment advice.
Leave a Comment