
| Company | Jul 25 | Aug 25 | Sep 25 | Oct 25 | Nov 25 | Dec 25 | Jan 26 | Feb 26 | Mar 26 | Apr 26 | May 26 | Jun 26 | 12-Mo |
|---|---|---|---|---|---|---|---|---|---|---|---|---|---|
| UAN | +7% | -1% | +0% | +5% | +6% | +6% | +1% | -4% | +28% | +2% | -3% | -8% | +41% |
| CF | +1% | -6% | +4% | -7% | -5% | -2% | +21% | +7% | +30% | -4% | -9% | -4% | +20% |
| YARIY | +1% | -1% | +0% | -0% | +0% | +11% | +13% | +10% | +16% | -0% | -3% | -19% | +25% |
| MOS | -1% | -7% | +5% | -21% | -11% | -1% | +14% | +1% | -8% | -9% | +4% | -11% | -40% |
| IPI | -7% | -9% | +0% | -13% | -5% | +10% | +18% | +13% | +16% | -7% | -1% | -16% | -8% |
Source: Yahoo Finance monthly adjusted close.
Executive Summary
Rating: BUY | UAN
Measured from adjusted close on 2026-07-15 to 2026-10-14. Sell ratings are correct when the stock falls; Hold is tracked as a +/-10% range. Daily-close data, not intraday. Calls are tracked for 182 days from publication, then frozen as a final record.
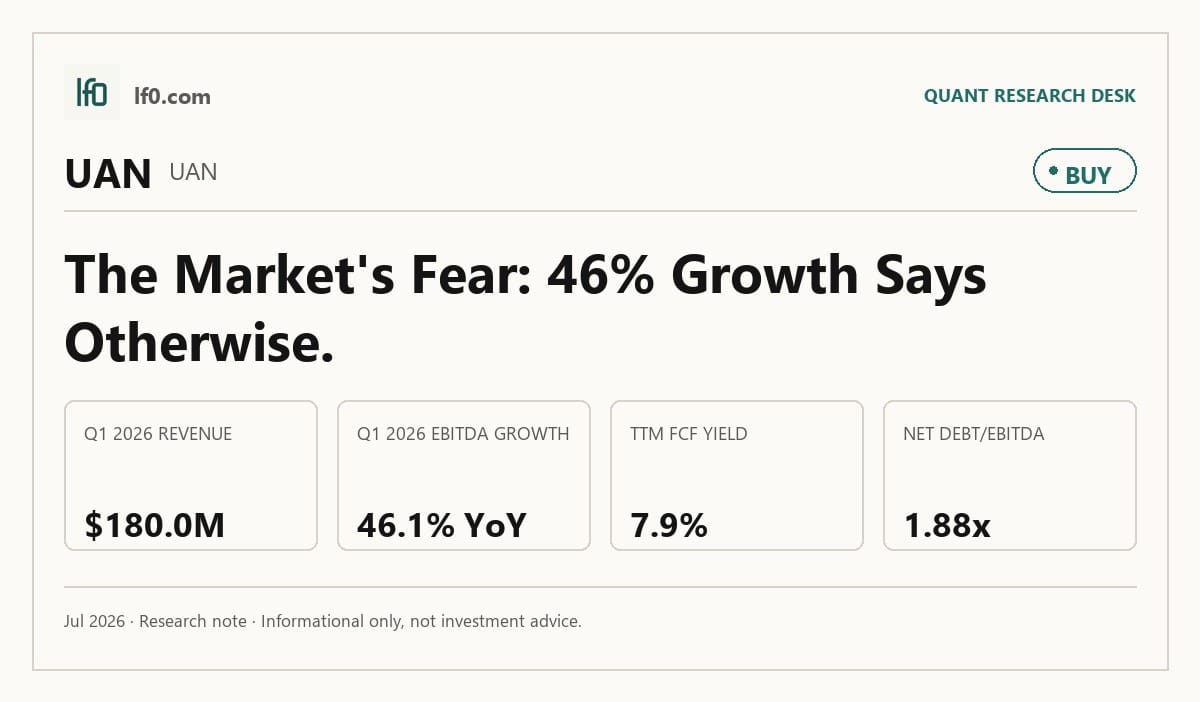
I would put my rating as a Buy because CVR Partners combines a hard-to-replicate nitrogen asset base with cash generation that is still holding up through a volatile fertilizer cycle. The Coffeyville pet coke gasification plant, East Dubuque’s logistics access, and the Section 45Q credit stream give the partnership structural support, while Q1 2026 revenue of $180M and EBITDA of $77.7M show the model is still converting that advantage into earnings. The main risk is commodity pricing, which already showed up in Q4 2025 when EBITDA fell to $20.2M and net income turned negative, so this is not a clean secular growth name. I would raise my rating more towards a Strong Buy if quarterly EBITDA can stay above roughly $60M, meaning the business is sustaining cash generation through the cycle rather than just one favorable quarter.
Company Profile
CVR Partners, LP is a Delaware master limited partnership formed in 2011 to own and operate a nitrogen fertilizer business. It produces ammonia and urea ammonium nitrate, or UAN, at two U.S. plants in Coffeyville, Kansas, and East Dubuque, Illinois, and sells those products wholesale to agricultural and industrial customers, mainly in the United States. The partnership went public in April 2011 and trades on the NYSE under UAN. Its revenue is tied to fertilizer pricing, plant utilization, and seasonal farm demand, so the business is cyclical even when the asset base is stable.
Economic Moat
Business Model
The Coffeyville facility is the most defensible part of the franchise because it is the only nitrogen fertilizer plant in North America that uses pet coke gasification to make hydrogen for ammonia and UAN. I feel that is hard to copy quickly because a competitor would need feedstock access, a gasifier complex, and a new permit path, while CVR Partners already has the 89 million standard cubic feet per day hydrogen unit, the 1,300 ton per day ammonia unit, and the 3,100 ton per day UAN unit in place. East Dubuque adds a second edge through its 1,075 ton per day ammonia unit, 950 ton per day UAN unit, pipeline access within 1 mile of the Northern Natural Gas system, and Mississippi River barge access, which lowers delivered-cost risk in the farm belt. The Section 45Q credit stream is another support, and according to their SEC filings the partnership expects to monetize those credits through March 31, 2030. That combination gives the business a real cost and logistics advantage, and it is consistent with the 32.4% TTM operating margin and 36.9% EBITDA margin in the financial section.
Business & Operating Risks
The biggest disclosed risk is nitrogen fertilizer price volatility, because the 10-K ties it directly to cash generation, distributions, and inventory outcomes. The filing says a decline in nitrogen prices could hurt business, cash flow, and distributions, and it also points to cyclical demand, weather, supply-demand imbalances, and trade policy as drivers of volatility. That risk is already visible in the numbers: Q4 2025 revenue fell to $131.1M and EBITDA dropped to $20.2M before Q1 2026 recovered, so the cycle is clearly moving through reported results. Feedstock dependence is another real exposure, since pet coke supply agreements end in December 2026 and natural gas transportation contracts expire in October 2026 and April 2028. In my view, these risks do not break the moat, but they do test it by making the cost advantage dependent on reliable feedstock access and disciplined plant operations.
Management Discussion & Analysis
Management is responding to those risks with capex, reliability work, and a feedstock-flexibility project. The 2026 capital plan calls for $60M to $75M of spending, including $25M to $30M of growth capex and $35M to $45M of maintenance capex, which tells me the partnership is still investing to protect the asset base rather than simply harvesting cash. The most important strategic move is the Coffeyville project that could allow dual feedstock flexibility, because that would let management switch between natural gas and third-party pet coke depending on relative economics. The 2025 Coffeyville turnaround was completed as scheduled in early November 2025 and all four nitric acid plants now have nitrous oxide abatement units, but 2025 utilization still fell to 88% from 96% in 2024, so the reliability message is improving faster than the output trend. Management also kept distributions generous, which supports the equity story but leaves less room for balance-sheet repair if pricing weakens. In my view, management is actively addressing the operating risks, but the utilization data shows the fix is not yet fully proven.
Recent Events
The most important recent event was the board reset after Brian Goebel’s death, which was disclosed on March 3, 2026. That briefly left the audit committee short of NYSE independence requirements, but Trevor Turbidy joined the board on March 17, 2026 and compliance was restored, so the governance issue was short-lived rather than a lasting listing problem. The January 26, February 18, and April 29, 2026 8-Ks were routine results releases, so they did not change the structural story. I see the board event as a small negative that was repaired quickly, which matters because this is a partnership where governance stability supports the distribution model.
Financial Analysis
Growth
UAN — Financial Growth (Quarterly, USD Mil)
| Metric | 2025-03-31 | 2025-06-30 | 2025-09-30 | 2025-12-31 | 2026-03-31 |
|---|---|---|---|---|---|
| REVENUE (USD Mil) | 142.9 | 168.6 | 163.5 | 131.1 | 180 |
| EBIT (USD Mil) | 34.8 | 46.3 | 50.7 | -2.8 | 57.8 |
| EBITDA (USD Mil) | 52.9 | 67.2 | 70.6 | 20.2 | 77.7 |
| NET INCOME (USD Mil) | 27.1 | 38.8 | 43.1 | -10.3 | 49.9 |
| DILUTED EPS | 2.6 | 3.7 | 4.1 | -1 | 4.7 |
Source: Yahoo Finance — Quarterly Financial Statements
Revenue rose from $142.9M in Q1 2025 to $180M in Q1 2026, and EBITDA increased from $52.9M to $77.7M over the same span. The quarter-to-quarter path was choppy, with Q4 2025 revenue down to $131.1M and EBITDA down to $20.2M, which looks more like a seasonal and operational trough than a structural break. That matters for the moat because the asset base only creates value if the plants run through the cycle, and the Q1 2026 rebound suggests the operating system still has that capacity. Growth is still cyclical, but the latest quarter shows the partnership can translate a better pricing backdrop into a sharp earnings recovery.
Profitability
UAN — Profitability (TTM)
| Metric | TTM |
|---|---|
| Operating Margin (TTM) | 32.4% |
| Net Margin (TTM) | 18.9% |
| Return on Assets (TTM) | 9.5% |
| Return on Equity (TTM) | 39.6% |
| Gross Margin (TTM) | 42.7% |
| EBITDA Margin (TTM) | 36.9% |
Source: Yahoo Finance — Trailing Twelve Months (TTM)
TTM operating margin was 32.4%, net margin 18.9%, gross margin 42.7%, EBITDA margin 36.9%, ROA 9.5%, and ROE 39.6%. The spread between gross margin and operating margin shows that plant and corporate costs still take a meaningful share of revenue, so operating discipline matters more here than simple price realization. ROE is much higher than ROA, which tells me leverage is amplifying returns rather than pure asset productivity doing all the work. That is fine in a stable cycle, but it also means the equity can re-rate quickly if margins soften. I would watch for operating margin staying above 30% and net margin remaining clearly positive, because that would confirm the business is still earning through the cycle rather than just benefiting from one strong quarter.
Valuation
UAN — Valuation Multiples
| Metric | Value |
|---|---|
| Market Cap (USD Mil) | 1,217 |
| Enterprise Value (USD Mil) | 1,664 |
| Trailing P/E | 10 |
| Forward P/E | -18.3 |
| Price/Sales (TTM) | 1.9 |
| EV/Revenue | 2.6 |
| EV/EBITDA | 7 |
| FCF Yield % (TTM) | 7.9% |
| Forward EPS (USD) | -6.3 |
| Analyst Target Price – Low (USD) | — |
| Analyst Target Price – Mean (USD) | — |
| Analyst Target Price – High (USD) | — |
Source: Yahoo Finance
I would put fair value in a range of roughly $46 to $175 per unit based on peer EV/revenue multiples and the company’s own leverage and cash conversion profile. That range is wide because the business is highly cyclical, and the negative forward EPS of -6.28 means earnings-based valuation is not a useful anchor right now. The current market cap of $1.2B, enterprise value of $1.7B, EV/EBITDA of 7.01x, and FCF yield of 7.86% suggest the market is paying for cash generation, not for a smooth earnings stream. There is no meaningful analyst consensus to compare against here because the reference data shows no target prices and no analyst coverage count. On my read, the stock looks cheap enough to own because the balance sheet is serviceable and the cash yield is real, but the negative forward EPS keeps this from being a clean multiple-expansion case.
Leverage
UAN — Leverage & Coverage (Quarterly)
| Metric | Value |
|---|---|
| Total Debt/Equity % (mrq) | 184.3 |
| Current Ratio (mrq) | 2.8 |
| Total Debt (mrq, USD Mil) | 574.6 |
| Operating Cash Flow (TTM, USD Mil) | 170 |
| Levered Free Cash Flow (TTM, USD Mil) | 95.7 |
| Net Debt/EBITDA (TTM) | 1.9 |
| FCF Margin % (TTM) | 14.9% |
Source: Yahoo Finance — Quarterly Financial Statements
Total debt was $574.6M and debt/equity was 184.3% at the most recent quarter, so the capital structure is levered for a commodity business. Even so, the current ratio of 2.8x and net debt/EBITDA of 1.9x tell me liquidity is adequate and leverage is manageable rather than stretched. Operating cash flow was $170M TTM and levered free cash flow was $95.7M TTM, which shows the business is still converting earnings into cash after capex and interest. The key point is that leverage amplifies the equity return profile, so the stock works best when margins stay strong and pricing remains constructive.
Insider Activity
The insider record is one-sided buying: Carl Icahn made repeated open-market purchases in April 2025, and there were no open-market sales in the window shown. The activity is concentrated in one holder, so I would not overstate breadth, but the direction is still constructive because the buying was voluntary and repeated. In my view, that supports the thesis that the units were attractive at those levels, even if it is not a broad insider signal.
Comparable Analysis
Growth
| Company | Revenue TTM (USD Mil) | Revenue Growth YoY % | EBITDA TTM (USD Mil) | Diluted EPS TTM |
|---|---|---|---|---|
| UAN | 643.2 | 26.0% | 237.4 | 11.5 |
| CF | 7,407 | 19.4% | 3,437 | 11.1 |
| YARIY | 16,223 | 16.6% | 2,744 | 2.8 |
| MOS | 12,429.5 | 14.4% | 1,993.1 | 0.1 |
| IPI | 242.4 | 6.2% | 63.5 | 1.1 |
Source: Yahoo Finance
UAN’s TTM revenue growth of 26.0% is the fastest in the peer set, ahead of CF at 19.4%, YARIY at 16.6%, MOS at 14.4%, and IPI at 6.2%. UAN’s TTM EBITDA of $237.4M and diluted EPS of 11.5 also compare well with CF’s $3.4B and 11.1, which tells me the company is growing from a smaller base but still converting that growth into earnings. The growth edge matters because the market is not paying for a slow mover here; it is paying for the strongest current inflection.
Valuation
| Company | Trailing P/E | Forward P/E | EV/Revenue | EV/EBITDA | Price/Sales (TTM) | Price/Book (mrq) | Market Cap (USD Mil) | Enterprise Value (USD Mil) | Beta (5Y Monthly) | FCF Yield % (TTM) | Forward EPS | Analyst Target Price – Low | Analyst Target Price – Mean | Analyst Target Price – High | # Analyst Opinions |
|---|---|---|---|---|---|---|---|---|---|---|---|---|---|---|---|
| UAN | 10 | -18.3 | 2.6 | 7 | 1.9 | 3.9 | 1,217 | 1,664 | 0.14 | 7.9% | -6.3 | — | — | — | — |
| CF | 10.6 | 10.5 | 3.1 | 6.6 | 2.4 | 3.4 | 18,094 | 22,803 | 0.39 | 5.9% | 11.2 | 100 | 125.7 | 195.7 | 19 |
| YARIY | 8.7 | 11.1 | 0.9 | 5.6 | 0.8 | 1.4 | 12,217 | 15,375 | 0.23 | 18.5% | 2.2 | 19.7 | 19.7 | 19.7 | 1 |
| MOS | 162.1 | 12.1 | 1 | 6.5 | 0.6 | 0.6 | 7,212 | 12,926 | 0.82 | -4.0% | 1.9 | 19 | 27.2 | 35 | 19 |
| IPI | 31.7 | 57.7 | 1.5 | 5.9 | 2 | 0.9 | 473 | 375 | 1.24 | 0.3% | 0.6 | 26 | 26 | 26 | 1 |
Source: Yahoo Finance
UAN trades at 2.59x EV/revenue and 7.01x EV/EBITDA, versus CF at 3.1x and 6.6x, YARIY at 0.9x and 5.6x, MOS at 1.0x and 6.5x, and IPI at 1.5x and 5.9x. On a one-year basis, a $1 investment would have become 1.45 in UAN, ahead of CF at 1.25, YARIY at 1.32, MOS at 0.66, and IPI at 1.03, so the stock has already re-rated with the cycle. I think that is important because UAN’s stronger growth and profitability are not being rewarded with a premium multiple, but the negative forward EPS means the market is still discounting a less stable earnings base than the headline returns suggest.
Profitability
| Company | Operating Margin (TTM) | Net Margin (TTM) | Return on Assets (TTM) | Return on Equity (TTM) | Gross Margin (TTM) | EBITDA Margin (TTM) |
|---|---|---|---|---|---|---|
| UAN | 32.4% | 18.9% | 9.5% | 39.6% | 42.7% | 36.9% |
| CF | 33.6% | 23.7% | 11.3% | 27.3% | 39.1% | 46.4% |
| YARIY | 13.6% | 8.6% | 6.9% | 16.9% | 28.9% | 16.9% |
| MOS | 0.8% | 0.4% | 2.0% | 0.6% | 13.3% | 16.0% |
| IPI | 9.0% | 5.8% | 2.1% | 3.0% | 26.0% | 26.2% |
Source: Yahoo Finance
UAN’s 32.4% operating margin and 36.9% EBITDA margin are above YARIY’s 13.6% and 16.9%, MOS’s 0.8% and 16.0%, and IPI’s 9.0% and 26.2%, while CF leads UAN on operating margin at 33.6% and EBITDA margin at 46.4%. UAN’s 42.7% gross margin also sits above YARIY, MOS, and IPI, which tells me the profitability edge is rooted in product economics and plant efficiency rather than just scale. ROE at 39.6% is the best in the group, but ROA at 9.5% trails CF’s 11.3%, so leverage is helping the equity return profile.
Leverage
| Company | Total Debt/Equity % (mrq) | Current Ratio (mrq) | Operating Cash Flow TTM (USD Mil) | Free Cash Flow TTM (USD Mil) | Net Debt/EBITDA (TTM) | FCF Margin % (TTM) |
|---|---|---|---|---|---|---|
| UAN | 184.3 | 2.8 | 170 | 95.7 | 1.9 | 14.9% |
| CF | 43.8 | 3.5 | 2,662 | 1,076.4 | 0.5 | 14.5% |
| YARIY | 46.8 | 1.8 | 2,089 | 2,263.2 | 1.1 | 14.0% |
| MOS | 48.2 | 1.2 | 886.1 | -289.8 | 2.8 | -2.3% |
| IPI | 0.7 | 5.3 | 68 | 1.5 | -1.5 | 0.6% |
Source: Yahoo Finance
UAN’s debt/equity of 184.3% is much higher than CF at 43.8%, YARIY at 46.8%, MOS at 48.2%, and IPI at 0.7%, but net debt/EBITDA of 1.9x is only modestly above CF at 0.5x and YARIY at 1.1x. UAN’s current ratio of 2.8x is also solid, though not as strong as IPI’s 5.3x, and its FCF margin of 14.9% is slightly ahead of CF at 14.5% and YARIY at 14.0%. That combination explains the valuation premium better than debt/equity alone: investors are paying for cash conversion and a workable balance sheet, not for a low-risk capital structure.
Conclusion
I would put my rating as a Buy because the key tension is not whether CVR Partners has a moat, but whether the latest earnings rebound is durable enough to keep cash flow ahead of the cycle. The answer so far is yes: Q1 2026 revenue of $180M, EBITDA of $77.7M, and TTM levered free cash flow of $95.7M show the business is still monetizing its asset base, and the quick repair of the board-compliance issue removes one governance overhang. I would raise my rating more towards a Strong Buy if quarterly EBITDA stays above about $60M, meaning the plants are still earning through the cycle rather than just benefiting from one favorable quarter, and if operating margin remains above 30%, which would confirm the cost structure is intact. I would move from Buy to Hold if quarterly EBITDA falls back toward the low-$20M level seen in Q4 2025, because that would tell me the cash yield is more fragile than it looks, or if revenue slips below $140M for another quarter, which would suggest the latest rebound was mostly seasonal.
My base case is still constructive because the downside has to come from a weaker fertilizer tape that has not yet shown up in the latest quarter. The stock is not priced for perfection, and that matters: I do not need heroic assumptions to stay positive, but I would want to see the next couple of quarters confirm that the current cash generation is repeatable before I call it a stronger buy.
What’s your take? I rated CVR Partners (UAN) BUY above — but the goal here is to get this right, not just to publish an opinion. What would you add to this analysis, or which risk or catalyst do you think I’m under- or over-weighting? Tell me in the comments.
Sources
- SEC 10-K Annual Report — filed 2026-02-18
- SEC 8-K Filing (2026-04-29)
- SEC 8-K Filing (2026-03-18)
- SEC 8-K Filing (2026-03-03)
- SEC 8-K Filing (2026-02-18)
- SEC 8-K Filing (2026-01-26)
- SEC 8-K Filing (2026-01-22)
- SEC Form 4 Insider Transaction (2025-04-23)
- SEC Form 4 Insider Transaction (2025-04-18)
- SEC Form 4 Insider Transaction (2025-04-15)
- SEC 10-K Annual Report — FY2026
- SEC 10-K Annual Report — FY2025
- SEC 10-K Annual Report — FY2024
- SEC 10-K Annual Report — FY2023
- SEC 10-K Annual Report — FY2022
Data sourced from Yahoo Finance and SEC EDGAR. Not investment advice.
Leave a Comment