
| Company | Jul 25 | Aug 25 | Sep 25 | Oct 25 | Nov 25 | Dec 25 | Jan 26 | Feb 26 | Mar 26 | Apr 26 | May 26 | Jun 26 | Trailing 12-Mo |
|---|---|---|---|---|---|---|---|---|---|---|---|---|---|
| ONTO | -6.12% | +11.87% | +21.91% | +4.44% | +6.08% | +10.27% | +27.99% | +6.85% | -5.01% | +43.88% | -12.48% | +46.55% | +274.96% |
| AMAT | -1.64% | -10.46% | +27.36% | +13.85% | +8.43% | +1.88% | +25.42% | +15.65% | -8.20% | +15.42% | +14.23% | +60.65% | +297.83% |
| LRCX | -2.57% | +5.60% | +33.96% | +17.60% | -0.93% | +9.91% | +36.38% | +0.18% | -8.54% | +20.69% | +23.39% | +36.29% | +347.64% |
| KLAC | -1.87% | -0.58% | +23.69% | +12.07% | -2.59% | +3.37% | +17.52% | +6.90% | -3.42% | +18.88% | +9.93% | +57.00% | +239.00% |
| NVMI | -4.58% | +0.29% | +21.39% | +7.81% | -9.23% | +4.97% | +39.42% | -4.15% | -1.04% | +15.23% | +0.38% | +8.08% | +97.29% |
| ASML | -13.09% | +6.90% | +30.36% | +9.61% | +0.07% | +0.93% | +33.01% | +2.07% | -8.94% | +9.18% | +12.08% | +23.36% | +150.19% |
Source: Yahoo Finance monthly adjusted close. Each column is a fully completed calendar month; the current in-progress month is excluded. Trailing 12-Mo compounds the 12 monthly returns.
Executive Summary
Rating: SELL | ONTO
Measured from adjusted close on 2026-07-14 to 2026-10-13. Sell ratings are correct when the stock falls; Hold is tracked as a +/-10% range. Daily-close data, not intraday. Calls are tracked for 182 days from publication, then frozen as a final record.
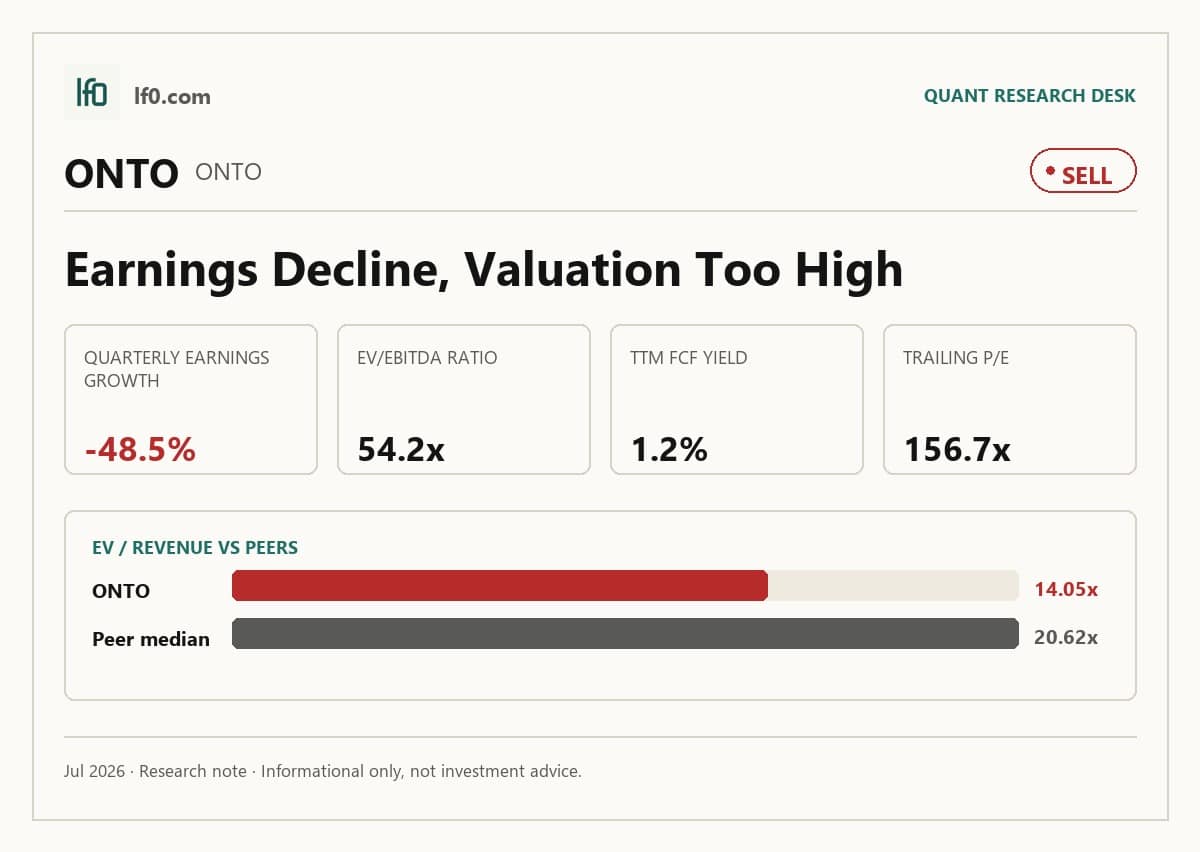
I would put my rating as a Sell because Onto Innovation’s valuation already discounts a much cleaner earnings path than the latest quarter supports. The business has a real moat in qualified process-control tools embedded in semiconductor fabs, but that advantage is being tested by customer concentration, tariff pressure, and export controls, while Q1 2026 revenue of $291.9M still translated into only $33.8M of net income. In my view, the key question is not whether the franchise is good; it is whether earnings can catch up fast enough to justify a 54.2x EV/EBITDA multiple and a 1.2% FCF yield. I would move more towards a Buy if operating margin gets into the high teens and revenue growth stays above 15.0% for two straight quarters, because that would show the top line is finally converting into durable profit.
Company Profile
Onto Innovation designs, manufactures, and supports metrology and inspection tools plus process-control software for semiconductor manufacturing. Its products cover optical critical-dimension metrology, wafer and panel inspection, advanced packaging lithography, and yield-management software, and the company sells into wafer makers, chip fabricators, advanced packaging houses, and specialty device markets such as LED, VCSEL, MEMS, CIS, SiC, and GaN.
The company went public in 2019 and expanded in Q4 2025 with the Semilab USA acquisition, which added FAaST, CnCV, and MBIR product lines for contamination monitoring and materials characterization. It operates globally, with offices across the U.S., Asia, and Europe, and manufacturing in Milpitas, Tucson, Wilmington, and Bloomington, plus contract manufacturers abroad. Onto Innovation is listed on Nasdaq under ONTO and had about 1,615 employees as of January 3, 2026.
Economic Moat
Business Model
The strongest structural advantage is the installed base of process-control tools inside semiconductor fabs and advanced packaging lines, where switching vendors is costly because the equipment is already qualified into the customer’s process flow. I feel that this is hard for a competitor to copy quickly because Onto’s systems span optical metrology, macro defect inspection, packaging lithography, and process-control software across front-end and back-end manufacturing, so a rival would need to win qualification at multiple process steps rather than sell one tool.
That moat is reinforced by 423 U.S. and foreign patents with expirations from 2026 to 2044, 312 pending patent applications, and 190 customers in 2025 across more than 25 countries. The Semilab USA acquisition broadens the product set, but in my view it adds adjacent capability rather than creating the moat from scratch. The business is also more diversified than it was five years ago, which matters because a broader customer and product footprint makes the installed-base advantage harder to dislodge.
Business & Operating Risks
According to the risk factors in Onto Innovation’s SEC 10-K, the largest customers account for a substantial portion of revenue, so a delayed or cancelled order from one buyer can move the numbers quickly. That risk is not theoretical: Q1 2026 revenue was $291.9M, and the company’s sales cycle can stretch from three to 24 months, which means timing shifts can hit a quarter even when end demand is intact.
Supply chain and tariff exposure are the next pressure points. The filing says Onto depends on a significant number of sole-source or single-source suppliers, some component lead times can exceed six months, and qualifying new suppliers for lasers and certain optics can take as long as a year. It also notes that 2025 U.S. tariffs increased costs and that export controls, including the September 2025 50% Rule, caused temporary revenue loss while licenses were obtained. Those risks do not break the moat, but they do make the installed-base advantage less profitable in the near term because the company cannot fully control shipment timing or input costs.
China export controls and broader international regulation have become a more visible risk than they were a few years ago, and the current filing also adds ERP, AI, and Semilab integration risk. The moat is still intact, but these issues can slow the conversion of that moat into earnings.
The disclosed risks are pressuring the moat’s economics more than its existence: the customer lock-in remains real, but concentration, trade controls, and supply-chain friction can delay the cash flow that the installed base should generate.
Management Discussion & Analysis
Management is responding to the operating risks with acquisition-led growth, buybacks, and a larger cash deployment posture, but the margin payoff is not yet clean. Cash, cash equivalents, and marketable securities fell to $639.6M at January 3, 2026 from $852.3M at December 28, 2024, mainly because 436.1M went to acquisitions and $75M went to common stock repurchases. That tells me management is willing to spend to extend the platform, yet it also means the balance sheet is being used to fund strategy rather than left idle as a cushion.
The Semilab USA acquisition is already showing up in revenue from Semilab customers in SiC specialty devices, but gross margin still fell to 49.7% in fiscal 2025 from 52.2% in fiscal 2024 because of excess and obsolete inventory write-downs, restructuring tied to infrastructure transition, and contract manufacturing setup costs. In other words, management is actively addressing the growth opportunity, but the operating response to the risks is still incomplete. The 4.3% secured line of credit gives flexibility, and with no draw outstanding it is a backstop rather than a stress signal.
Management’s tone remains constructive, but the numbers say the company is still working through the cost of expansion. That is consistent with the moat thesis above: the franchise is strong, yet the current challenge is turning that structural position into cleaner earnings.
Recent Events
The most important recent event is the April 21, 2026 agreement to buy 27.0% of Rigaku Holdings for about $710M, paired with a $500M senior secured 364-day bridge facility from Goldman Sachs Bank USA. I view that as a strategic bet on X-ray process control, but it also adds execution risk because Onto is committing capital to a non-core equity stake before the payoff is proven.
The May 18, 2026 convertible note offering is the second key development. Onto issued $1.5B of 0.00% Convertible Senior Notes due 2031 after the initial purchasers exercised a $200M option in full, which gives management cheap capital but also raises the bar for the Rigaku investment to earn its cost of capital. The May 20 annual meeting was routine, with all directors elected and Ernst & Young LLP ratified.
Taken together, the recent events strengthen the strategic footprint, but they also increase the burden on execution. The moat is not being threatened directly; rather, management is choosing to extend it with more capital, which makes follow-through more important.
Financial Analysis
Growth
ONTO — Financial Growth (Quarterly, USD Mil)
| Metric | 2025-03-31 | 2025-06-30 | 2025-09-30 | 2025-12-31 | 2026-03-31 |
|---|---|---|---|---|---|
| REVENUE (USD Mil) | 266.6 | 253.6 | 218.2 | 266.9 | 291.9 |
| EBIT (USD Mil) | 64.3 | 38.5 | 27.8 | 20.9 | 38.7 |
| EBITDA (USD Mil) | 77.1 | 52.8 | 41.1 | 40.8 | 64.2 |
| NET INCOME (USD Mil) | 64.1 | 33.9 | 28.2 | 10.5 | 33.8 |
| DILUTED EPS | 1.3 | 0.7 | 0.6 | 0.2 | 0.7 |
Source: Yahoo Finance — Quarterly Financial Statements
ONTO’s revenue rose from $218.0M in Q3 2025 to $267.0M in Q4 2025 and then to $291.9M in Q1 2026. That is a 9.5% increase versus the prior-year TTM base, which is respectable but not enough on its own to justify the stock’s valuation. EBITDA improved to $64.2M in Q1 2026 from $40.8M in Q4 2025, so the rebound is real, but it is still below the $77.1M posted in Q1 2025, which tells me the business is recovering unevenly rather than compounding cleanly.
The pattern looks consistent with semiconductor equipment timing rather than a broken demand backdrop, and it also fits the moat: a qualified process-control franchise can be lumpy quarter to quarter while still retaining customer stickiness. What matters now is whether the higher revenue base can hold long enough to pull margins up with it.
Profitability
ONTO — Profitability (TTM)
| Metric | TTM |
|---|---|
| Operating Margin (TTM) | 16.8% |
| Net Margin (TTM) | 10.3% |
| Return on Assets (TTM) | 5.4% |
| Return on Equity (TTM) | 5.3% |
| Gross Margin (TTM) | 54.2% |
| EBITDA Margin (TTM) | 25.9% |
Source: Yahoo Finance — Trailing Twelve Months (TTM)
TTM operating margin was 16.8%, net margin was 10.3%, gross margin was 54.2%, EBITDA margin was 25.9%, ROA was 5.4%, and ROE was 5.3%. The 37.4-point spread between gross margin and operating margin tells me the core business still carries a heavy operating expense load, so the issue is not product economics but operating leverage.
EBITDA margin sits 9.1 points above operating margin, which means depreciation, amortisation, and other non-cash charges are meaningful, and I would weight cash conversion more heavily than GAAP earnings when judging progress. The small gap between ROA and ROE also tells me returns are not being inflated by leverage; this is a clean balance sheet generating modest returns, not a debt-driven equity story. I would want to see operating margin move into the high teens before I call the earnings quality fully repaired.
Valuation
ONTO — Valuation Multiples
| Metric | Value |
|---|---|
| Market Cap (USD Mil) | 15,905 |
| Enterprise Value (USD Mil) | 14,478 |
| Trailing P/E | 156.7 |
| Forward P/E | 32.1 |
| Price/Sales (TTM) | 15.4 |
| Price/Book (mrq) | 7.5 |
| EV/Revenue | 14 |
| EV/EBITDA | 54.2 |
| Beta (5Y Monthly) | 1.54 |
| FCF Yield % (TTM) | 1.2% |
| Forward EPS (USD) | 9.9 |
| Analyst Target Price – Low (USD) | 330 |
| Analyst Target Price – Mean (USD) | 369.6 |
| Analyst Target Price – High (USD) | 450 |
| # Analyst Opinions | 10 |
Source: Yahoo Finance
ONTO trades at 156.7x trailing P/E, 32.1x forward P/E, 14.0x EV/Revenue, 54.2x EV/EBITDA, and 1.2% FCF yield. Those are demanding multiples for a company with 9.5% revenue growth and only 10.3% net margin, even if the balance sheet is clean. The market is paying for a semiconductor process-control franchise that can keep revenue near a roughly $1.2B annualized run rate while preserving high gross profit dollars, not for near-term earnings acceleration.
On the analysis here, I would put fair value in a range of $295–$442 per share. That sits broadly inside the analyst target range of $330–$450, which tells me the sell-side is also assuming a meaningful earnings recovery, but my range leans toward the lower half because I weight the current margin profile and the 1.2% FCF yield more heavily than consensus appears to. Forward EPS is 9.95, and that is rich relative to the company’s own current operating margin because the stock is already discounting a much better conversion of revenue into profit.
The valuation case is tied to the operating case: if margins do not expand, the multiple has little room to compress gracefully.
Leverage
ONTO — Leverage & Coverage (Quarterly)
| Metric | Value |
|---|---|
| Total Debt/Equity % (mrq) | — |
| Current Ratio (mrq) | 6.2 |
| Total Debt (mrq, USD Mil) | 0 |
| Operating Cash Flow (TTM, USD Mil) | 262.7 |
| Levered Free Cash Flow (TTM, USD Mil) | 197.2 |
| Net Debt/EBITDA (TTM) | -2.5 |
| FCF Margin % (TTM) | 19.1% |
Source: Yahoo Finance — Quarterly Financial Statements
ONTO has zero debt, a current ratio of 6.154x, and net debt/EBITDA of -2.5x, which means cash exceeds debt by a wide margin. Operating cash flow was $262.7M TTM, levered free cash flow was $197.2M, and FCF margin was 19.1%, so the company is converting earnings into cash at a healthy rate.
That balance sheet gives management room to keep investing through a semiconductor cycle without refinancing pressure, and it is one reason the stock can trade at a premium to weaker capital structures. Still, leverage is a support rather than the thesis itself: AMAT, LRCX, and KLAC all generate much larger free cash flow, so Onto’s cleaner capital structure does not fully offset its weaker earnings conversion.
Insider Activity
The insider record is one-sided, with six director awards on May 20, 2026 and two Form 4 transactions on May 15, 2026 from senior executives. I do not read that as a strong buy signal, because the activity does not show meaningful open-market buying, and the mix is more consistent with routine equity administration than with a clear insider conviction trade.
Comparable Analysis
Growth
| Company | Revenue TTM (USD Mil) | Revenue Growth YoY % | EBITDA TTM (USD Mil) | Diluted EPS TTM |
|---|---|---|---|---|
| ONTO | 1,030.6 | 9.5% | 266.9 | 2 |
| AMAT | 29,024 | 11.4% | 9,275 | 10.6 |
| LRCX | 21,681.8 | 23.8% | 7,847.8 | 5.3 |
| KLAC | 13,096.7 | 11.5% | 5,850.2 | 3.5 |
| NVMI | 902.5 | 10.3% | 283.9 | 7.6 |
| ASML | 33,692.7 | 13.2% | 12,704.4 | 28.3 |
Source: Yahoo Finance
ONTO’s revenue growth was 9.5% in TTM, below LRCX at 23.8% and ASML at 13.2%, but close to AMAT at 11.4% and KLAC at 11.5%. NVMI was 10.3%, so ONTO is not an outlier on growth, but it is also not the fastest name in the group. The key point is that ONTO’s growth is adequate, not dominant, which makes its premium valuation harder to defend on top-line momentum alone.
Valuation
| Company | Trailing P/E | Forward P/E | EV/Revenue | EV/EBITDA | Price/Sales (TTM) | Price/Book (mrq) | Market Cap (USD Mil) | Enterprise Value (USD Mil) | Beta (5Y Monthly) | FCF Yield % (TTM) | Forward EPS | Analyst Target Price – Low | Analyst Target Price – Mean | Analyst Target Price – High | # Analyst Opinions |
|---|---|---|---|---|---|---|---|---|---|---|---|---|---|---|---|
| ONTO | 156.7 | 32.1 | 14 | 54.2 | 15.4 | 7.5 | 15,905 | 14,478 | 1.54 | 1.2% | 9.9 | 330 | 369.6 | 450 | 10 |
| AMAT | 56.1 | 35.8 | 15.7 | 49.1 | 16.3 | 19.8 | 473,585 | 455,863 | 1.57 | 0.6% | 16.7 | 358 | 612.2 | 900 | 35 |
| LRCX | 65.6 | 42.9 | 19 | 52.4 | 20 | 40.9 | 433,423 | 411,572 | 1.80 | 1.0% | 8.1 | 220 | 364.5 | 500 | 31 |
| KLAC | 65.6 | 45.2 | 22.3 | 49.8 | 23.1 | 51.9 | 302,475 | 291,507 | 1.41 | 1.0% | 5.1 | 150 | 231.1 | 325 | 28 |
| NVMI | 63.4 | 37 | 15.6 | 49.7 | 16.9 | 11 | 15,248 | 14,094 | 1.74 | 0.8% | 13 | 540 | 603.4 | 640 | 8 |
| ASML | 63 | 35.5 | 1,096.7 | 2,908.5 | 20.4 | 1,604.5 | 687,082 | 36,950,765 | 1.39 | 1.2% | 50.2 | 884.8 | 1,904 | 2,622.4 | 15 |
Source: Yahoo Finance
ONTO trades at 14.0x EV/Revenue and 15.4x Price/Sales, versus AMAT at 15.7x and LRCX at 19.0x, while KLAC and NVMI sit at 22.3x and 15.6x respectively. ASML’s EV/Revenue is far higher because of its very different business mix, so I do not use it as a clean anchor for ONTO. ONTO’s 1.2% FCF yield is below the stronger cash generators in the group, and that lines up with the stock’s recent performance: a 1 investment a year ago would be worth 3.07 in ONTO, which is good, but not enough to justify assuming the next leg higher is automatic.
Profitability
| Company | Operating Margin (TTM) | Net Margin (TTM) | Return on Assets (TTM) | Return on Equity (TTM) | Gross Margin (TTM) | EBITDA Margin (TTM) |
|---|---|---|---|---|---|---|
| ONTO | 16.8% | 10.3% | 5.4% | 5.3% | 54.2% | 25.9% |
| AMAT | 31.9% | 29.3% | 14.9% | 39.7% | 49.0% | 32.0% |
| LRCX | 35.0% | 30.9% | 22.8% | 66.8% | 50.0% | 36.2% |
| KLAC | 41.2% | 35.7% | 21.3% | 95.0% | 61.5% | 44.7% |
| NVMI | 30.1% | 29.2% | 8.4% | 22.3% | 57.3% | 31.4% |
| ASML | 36.0% | 29.7% | 15.7% | 52.2% | 52.6% | 37.7% |
Source: Yahoo Finance
ONTO’s gross margin was 54.2% TTM, above AMAT at 49.0%, LRCX at 50.0%, and ASML at 52.6%, but its operating margin was only 16.8% versus 31.9%, 35.0%, and 36.0% for those peers. EBITDA margin at 25.9% also trails AMAT at 32.0%, LRCX at 36.2%, KLAC at 44.7%, NVMI at 31.4%, and ASML at 37.7%, which tells me the company is not yet converting gross profit into operating profit at peer quality. ROE of 5.3% and ROA of 5.4% are also well below the group, so the return profile is still the weakest part of the equity case.
Leverage
| Company | Total Debt/Equity % (mrq) | Current Ratio (mrq) | Total Debt (mrq, USD Mil) | Operating Cash Flow TTM (USD Mil) | Free Cash Flow TTM (USD Mil) | Net Debt/EBITDA (TTM) | FCF Margin % (TTM) |
|---|---|---|---|---|---|---|---|
| ONTO | — | 6.2 | 0 | 262.7 | 197.2 | -2.5 | 19.1% |
| AMAT | 30.4 | 2.5 | 7,268 | 7,993 | 3,040.4 | -0.1 | 10.5% |
| LRCX | 35.3 | 2.5 | 3,734.5 | 6,954.6 | 4,352.3 | -0.1 | 20.1% |
| KLAC | 105.4 | 3 | 6,145.4 | 4,401.6 | 2,890.2 | 0.2 | 22.1% |
| NVMI | 57.7 | 1.6 | 800.2 | 217.1 | 122.4 | -1.1 | 13.6% |
| ASML | 13 | 1.4 | 2,705.6 | 10,531.5 | 8,243.3 | -0.4 | 24.5% |
Source: Yahoo Finance
ONTO’s zero debt and 6.154x current ratio are cleaner than AMAT’s 30.4% debt/equity, LRCX’s 35.3%, KLAC’s 105.4%, and NVMI’s 57.7%. That balance-sheet strength helps explain why the stock can trade at a premium despite weaker margins, but it does not fully justify the valuation because the peer group also includes much stronger free-cash-flow generators. In other words, Onto’s leverage profile is a support, not a substitute, for earnings quality.
Conclusion
I would put my rating as a Sell because the stock already prices in a better earnings trajectory than the latest quarter and peer comparison justify. The core tension is that Onto has a real moat, a clean balance sheet, and solid gross margins, but customer concentration, tariff exposure, and export controls are slowing the conversion of that moat into operating profit. Q1 2026 revenue of $291.9M and $33.8M of net income show the business is still profitable, yet the 54.2x EV/EBITDA multiple and 1.2% FCF yield leave very little room for execution error.
I would raise my rating more towards a Buy if revenue growth stays above 15.0% for two straight quarters and operating margin moves into the high teens, because that would show the recent rebound is becoming durable earnings power rather than a timing bounce. On a roughly $1.2B annualized revenue base, a 2-point margin improvement would add about $24M of annual operating profit, which would start to narrow the gap between Onto’s gross margin strength and its weaker peer-level returns.
I would move from Sell to Hold if growth holds but margins merely stabilize, and I would move further down if revenue growth slips back below 8.0% for two straight quarters or if quarterly earnings growth stays negative while the stock remains near its 52-week high of 386.5. That would tell me the market is still paying for a recovery that is not arriving fast enough.
My final view is that the balance sheet gives Onto time, but not enough to ignore the valuation. The moat is real, yet the numbers still say the burden of proof sits with management.
What’s your take? I rated Onto Innovation (ONTO) SELL above — but the goal here is to get this right, not just to publish an opinion. What would you add to this analysis, or which risk or catalyst do you think I’m under- or over-weighting? Tell me in the comments.
Sources
- SEC 10-K Annual Report — filed 2026-02-24
- SEC 8-K Filing (2026-05-21)
- SEC 8-K Filing (2026-05-20)
- SEC 8-K Filing (2026-05-18)
- SEC 8-K Filing (2026-05-05)
- SEC 8-K Filing (2026-04-21)
- SEC 8-K Filing (2026-04-16)
- SEC Form 4 Insider Transaction (2026-05-22)
- SEC Form 4 Insider Transaction (2026-05-22)
- SEC Form 4 Insider Transaction (2026-05-22)
- SEC 10-K Annual Report — FY2026
- SEC 10-K Annual Report — FY2025
- SEC 10-K Annual Report — FY2024
- SEC 10-K Annual Report — FY2023
- SEC 10-K Annual Report — FY2022
Data sourced from Yahoo Finance and SEC EDGAR. Not investment advice.
Leave a Comment