Expected price range
Each range is set from the stock’s recent price history and our Hold rating, using its own 1-year realised volatility (22% annualised) as the width of a ~68% statistical band, and checked against that rating so the range leans the same way as our view. Starting price $39.91 (close 2026-11-09). The stock traded between $34.44 and $42.62 over the last 6 months and between $33.41 and $42.62 over the last year. This is an illustration of where our view and normal volatility point, not a forecast, price target or investment advice; the stock can move outside it.
| Company | Nov 25 | Dec 25 | Jan 26 | Feb 26 | Mar 26 | Apr 26 | May 26 | Jun 26 | Jul 26 | Aug 26 | Sep 26 | Oct 26 | 12-Mo |
|---|---|---|---|---|---|---|---|---|---|---|---|---|---|
| BIP | +6% | -4% | +4% | +9% | -7% | -1% | +10% | -7% | +14% | -8% | -6% | +5% | +13% |
| BIPC | +2% | -1% | +5% | +5% | -21% | -6% | +13% | -7% | +10% | -9% | -7% | +5% | -14% |
| CWEN | +15% | -8% | +9% | +6% | +4% | +3% | +2% | -16% | -7% | +0% | -6% | +9% | +6% |
| VST | -5% | -10% | -2% | +10% | -13% | +5% | +2% | -1% | -7% | -7% | +1% | +0% | -26% |
| SO | -2% | -4% | +2% | +10% | -1% | +0% | -4% | +4% | -1% | -6% | -6% | +13% | +3% |
Source: Yahoo Finance monthly adjusted close.
<a id="lf0-thesis"></a>
Quick Thesis
- Rated Hold — durable contracted assets, but leverage and cash conversion cap upside.
- Strongest financial support: <span class="lf0-key" data-src="Yahoo Finance — Key Statistics (Cash Flow Statement): Operating Cash Flow (TTM)">$6B</span> operating cash flow in 2025.
- Key risk: <span class="lf0-key" data-src="Derived calculation: (Total Debt (mrq) – Total Cash (mrq)) ÷ EBITDA (TTM)">5.9x</span> net debt/EBITDA and only <span class="lf0-key" data-src="Yahoo Finance — Key Statistics (Cash Flow Statement): Levered Free Cash Flow (TTM) ÷ Revenue (TTM)">0.9%</span> FCF margin.
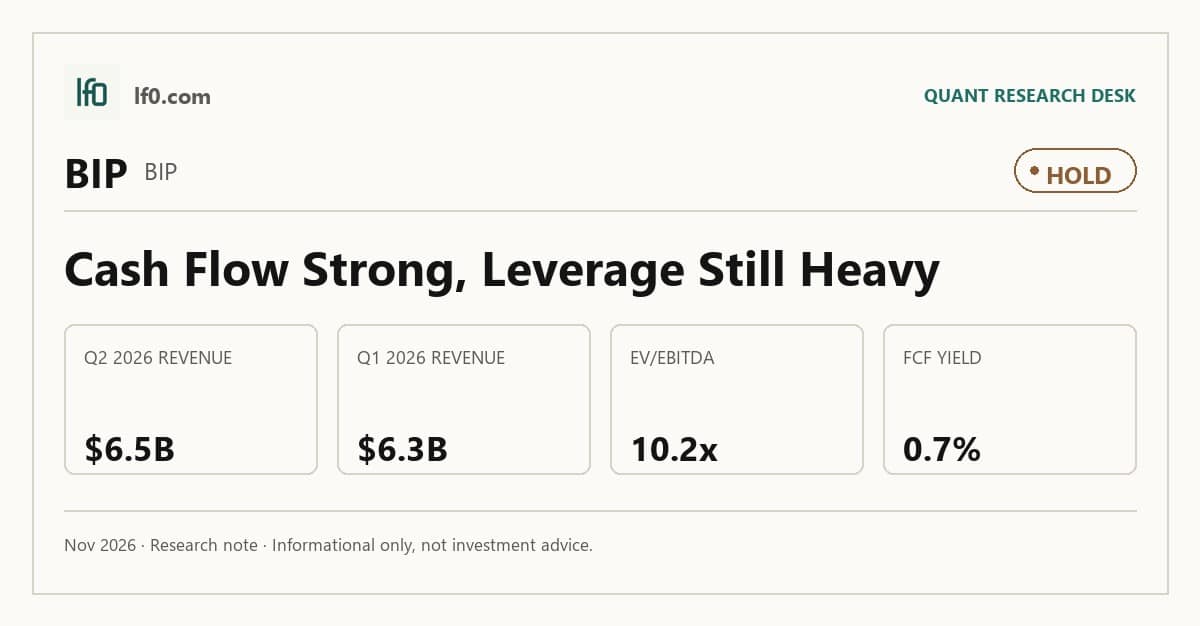
- Valuation is mid-pack at <span class="lf0-key" data-src="Yahoo Finance — Key Statistics: EV/EBITDA">10.2x</span> EV/EBITDA and a <span class="lf0-key" data-src="Derived calculation: Levered Free Cash Flow (TTM) ÷ Market Cap">0.7%</span> FCF yield.
- I would turn more constructive if free cash flow margin moved materially above <span class="lf0-key" data-src="Yahoo Finance — Key Statistics (Cash Flow Statement): Levered Free Cash Flow (TTM) ÷ Revenue (TTM)">0.9%</span>.
<a id="lf0-summary"></a>
Executive Summary
Measured from adjusted close on 2026-11-09 to 2026-11-09. Sell ratings are correct when the stock falls; Hold is tracked as a +/-10% range. Daily-close data, not intraday. Calls are tracked for 182 days from publication, then frozen as a final record.
I would put my rating as a Hold because Brookfield Infrastructure Partners has a durable, regulated and contracted asset base, but the current valuation already discounts much of that quality while leverage still limits flexibility. The portfolio is about 90.0% supported by regulated or contractual revenues, which is the core reason I like the business, yet the stock still trades at <span class="lf0-key" data-src="Yahoo Finance — Key Statistics: EV/EBITDA">10.2x</span> EV/EBITDA and only a <span class="lf0-key" data-src="Derived calculation: Levered Free Cash Flow (TTM) ÷ Market Cap">0.7%</span> FCF yield, so investors are paying for stability without getting much cash return today.
I would raise my rating more towards a Buy if free cash flow margin moved materially above the current <span class="lf0-key" data-src="Yahoo Finance — Key Statistics (Cash Flow Statement): Levered Free Cash Flow (TTM) ÷ Revenue (TTM)">0.9%</span> TTM level and the 2025 acquisition wave proved it could convert into cleaner cash generation rather than just larger reported EBITDA. That would tell me the leverage burden is becoming easier to carry and that distribution growth is being funded by real cash, not balance-sheet stretch.
<a id="lf0-business"></a>
Company Profile
Brookfield Infrastructure Partners L.P. is a Bermuda exempted limited partnership established in 2007 and spun off from Brookfield in 2008. It owns and operates utilities, transport, midstream, and data assets across the Americas, Asia Pacific, and Europe, with regulated transmission, distribution, rail, toll roads, pipelines, storage, telecom towers, fiber, and data centers making up the portfolio.
The partnership has reshaped itself through capital recycling and acquisitions, including HomeServe in 2023, Colonial Enterprises in 2025, and Wells Fargo Rail in January 2026, a railcar and locomotive fleet platform. Brookfield Infrastructure is listed on the New York Stock Exchange under BIP, and its quarterly distribution was raised 6.0% to $0.455 per unit in January 2026.
Economic Moat
Business Model
The moat is built on long-dated concessions, ship-or-pay contracts, and regulated rate bases that are hard to assemble quickly. According to their 20-F, about 90.0% of adjusted EBITDA comes from regulated or contractual revenues, with the utilities segment anchored by 30-year Brazilian electricity transmission concessions, fully contracted Brazilian gas transmission capacity, 20-year take-or-pay industrial gas contracts in South Korea, and long-term residential infrastructure and sub-metering contracts.
I also see a second layer of advantage in scale and density. The U.K. regulated distribution platform, the North American sub-metering business with about 0.8 million contracted services, the Australian and New Zealand smart meter base of 3.1 million meters under management, and the global intermodal logistics fleet of about 7.4 million TEUs all create local density that is difficult to replicate quickly. The data segment adds another layer, with over 150 data centers and about 1.2 GW of operating capacity today, plus 1.1 GW of future development capability, which deepens the cash flow base and gives the partnership more exposure to AI-related infrastructure.
Business & Operating Risks
The most material disclosed risk is execution on the 2025 acquisition wave, because the partnership added Hotwire, Colonial, and Mantiqueira in 2025 and the filing says the fair values for Hotwire and Colonial are still provisional. That matters because the 2025 20-F shows $10B of acquisition spending in investing cash flow, $59.6B of non-recourse borrowings, and $4.8B of goodwill added in 2025, so any misstep in integration or valuation would hit a balance sheet that already carries a 63.0% consolidated net debt-to-capitalization ratio.
The second risk is valuation and impairment sensitivity in the assets that now dominate the portfolio. The risk factors in their SEC 10-K say Brookfield Infrastructure relies on revaluation methods and discounted cash flow models for property, plant and equipment, investment properties, and goodwill, with key inputs including discount rates, terminal value multiples, and useful lives. That is important because 2025 revaluation gains were large, including $1.8B on property, plant and equipment and $1.4B of revaluation surplus for limited partners, so the reported equity base is sensitive to assumptions rather than only to cash earnings.
Foreign exchange and interest rate exposure are real, but they are more of a background drag than a thesis breaker. The filing discloses $17.8B of interest rate swaps and $3.7B of foreign exchange contracts, and 2025 still produced $268M of cash flow hedge losses and $179M of net investment hedge losses in other comprehensive income. The partnership is actively hedged, and the impact has stayed below the scale of operating cash flow, which was <span class="lf0-key" data-src="Yahoo Finance — Key Statistics (Cash Flow Statement): Operating Cash Flow (TTM)">$6B</span> in 2025.
The disclosed risks do not directly threaten the moat itself; they mainly test whether Brookfield can keep converting that moat into cash without overpaying for growth or stretching the balance sheet.
Management Discussion & Analysis
Management is clearly leaning into growth rather than balance-sheet repair, and that is the right read of the 2025 distribution increase to $0.455 per unit, or $1.82 annualized, alongside a 60.0% to 70.0% FFO payout target. The board is comfortable funding a higher payout from a business that generated $2.6B of FFO in 2025 and $2B of AFFO in 2025, but the 89.0% AFFO payout ratio shows there is little room left after maintenance capital, so the distribution is being supported by a narrow cash cushion rather than excess free cash.
The same pattern shows up in capital allocation. Management is pursuing a large development pipeline, including $7.1B of total capital to be commissioned in the data segment as of December 31, 2025, with $3.9B tied to the Intel partnership to build two semiconductor foundries in Arizona. That is a long-duration growth opportunity, but it also means the next phase of value creation depends on execution before that capital turns into cash flow.
Management’s track record is mixed but not weak. In 2024, the board targeted 5.0% to 9.0% annual distribution growth, and the 2025 increase of 6.0% fits that range, while 2025 FFO per unit rose 6.0% to $3.32. The main caveat is leverage, with net debt to capitalization at 73.0% in 2025 versus 69.0% in 2024, so the growth plan is being funded with a more stretched capital structure.
Recent Events
The recent acquisitions matter because they extend the moat into more contracted infrastructure, but they also raise the execution bar. HomeServe, Colonial, and Wells Fargo Rail broaden the asset mix and add more fee-like or contracted cash flow, yet they also increase the amount of integration work and purchase-accounting judgment the partnership has to get right.
The January 2026 purchase of Wells Fargo Rail is especially relevant because it adds scale in railcar and locomotive leasing, a business where fleet utilization and residual value discipline matter. In my view, that is consistent with Brookfield’s capital recycling model, but it also means the partnership is still relying on disciplined underwriting to keep the moat intact.
Financial Analysis
<a id="lf0-growth"></a>
Growth
BIP — Financial Growth (Quarterly, USD Mil)
| Metric | 2025-03-31 | 2025-06-30 | 2025-09-30 | 2025-12-31 | 2026-03-31 | 2026-06-30 |
|---|---|---|---|---|---|---|
| REVENUE (USD Mil) | — | 5,429 | 5,975 | 6,304 | 6,301 | 6,482 |
| EBIT (USD Mil) | — | 1,318 | 2,051 | 1,663 | 1,302 | 1,751 |
| EBITDA (USD Mil) | — | 2,259 | 3,101 | 2,736 | 2,377 | 2,846 |
| NET INCOME (USD Mil) | — | 74 | 291 | 300 | 0 | 62 |
| DILUTED EPS | 0 | 0 | 0.4 | — | -0.2 | -0.1 |
Source: Yahoo Finance — Quarterly Financial Statements
Revenue moved from $5.4B in Q2 2025 to $6.5B in Q2 2026, and from $5.4B in Q1 2025 to $6.3B in Q1 2026, so the business is still growing at a double-digit pace. EBITDA rose faster than revenue in both periods, reaching $2.8B in Q2 2026 and $2.4B in Q1 2026, which tells me the asset base is still producing operating leverage rather than just top-line expansion.
The flat Q1 2026 revenue versus Q4 2025’s $6.3B looks like a pause rather than a break. That matters because the moat is supposed to produce steady, contracted cash flow, and the latest numbers still fit that pattern.
Growth versus peers
| Company | Revenue TTM (USD Mil) | Revenue Growth YoY % | Diluted EPS TTM |
|---|---|---|---|
| <span class="lf0-primary">BIP</span> | 25,643 | 9.7% | 0.1 |
| BIPC | 3,691 | -0.7% | -2.9 |
| CWEN | 1,574 | 22.7% | 0.8 |
| VST | 20,588 | 27.7% | 7.4 |
| SO | 31,199 | 13.0% | 4.4 |
Source: Yahoo Finance
BIP’s revenue growth of 9.7% TTM sits above BIPC’s -0.7% and below CWEN’s 22.7% and VST’s 27.7%, while SO posted 13.0%. That puts BIP in the middle of the group, and the market is not paying a growth premium for it on a pure revenue basis.
<a id="lf0-profitability"></a>
Profitability
TTM gross margin was 26.4%, EBITDA margin was 41.2%, operating margin was 23.8%, net margin was 0.4%, ROA was 3.2%, and ROE was 5.8%. The spread from gross margin to operating margin is 2.6 percentage points, which says the core asset base is still producing healthy gross profit but overhead and non-cash charges take a meaningful slice before earnings reach the bottom line.
The wider gap between EBITDA margin and net margin shows that depreciation, amortisation, interest, and other below-EBITDA items still absorb most of the profit pool. I would therefore weight EBITDA and operating margin more heavily than net margin when judging run-rate earnings power, especially because the leverage profile makes the after-interest line more sensitive than the operating line.
Profitability versus peers
| Company | Operating Margin (TTM) | Net Margin (TTM) | Return on Assets (TTM) | Return on Equity (TTM) | Gross Margin (TTM) | EBITDA Margin (TTM) |
|---|---|---|---|---|---|---|
| <span class="lf0-primary">BIP</span> | 23.8% | 0.4% | 3.2% | 5.8% | 26.4% | 41.2% |
| BIPC | 58.2% | -6.8% | 5.8% | 21.3% | 61.7% | 76.4% |
| CWEN | 25.2% | 6.4% | 1.0% | -3.2% | 64.4% | 74.2% |
| VST | 31.1% | 13.1% | — | — | 41.5% | 38.2% |
| SO | 36.9% | 16.0% | 3.4% | 11.9% | 48.5% | 47.2% |
Source: Yahoo Finance
BIP’s operating margin of 23.8%, gross margin of 26.4%, EBITDA margin of 41.2%, and net margin of 0.4% trail BIPC’s 58.2%, 61.7%, 76.4%, and -6.8%, and also sit below CWEN’s 25.2%, 64.4%, and 74.2%, SO’s 36.9%, 48.5%, and 47.2%, and VST’s 31.1%, 41.5%, and 38.2%. The gap looks structural rather than cyclical: BIP’s lower gross margin points to a more expensive cost base at the asset level, while the wider operating-margin gap versus BIPC and CWEN shows less scale efficiency in overhead absorption.
<a id="lf0-valuation"></a>
Valuation
Brookfield Infrastructure Partners trades at 4.2x EV/Revenue and <span class="lf0-key" data-src="Yahoo Finance — Key Statistics: EV/EBITDA">10.2x</span> EV/EBITDA, with a 1.2x Price/Sales ratio and a 4.1x Price/Book multiple at a current share price of $39.9. The 4.2x EV/Revenue multiple is the cleanest anchor here because the business is capital intensive and cash conversion matters more than headline earnings alone; at that level, the market is pricing durable infrastructure cash flows with modest growth, not a rapid re-rating.
The 285.0x trailing P/E is not a useful cheapness signal because the earnings base is distorted by the partnership structure and non-cash items. Forward P/E is 33.9x, which still implies the market expects earnings to compound faster than a mature utility-like asset base. FCF yield is <span class="lf0-key" data-src="Derived calculation: Levered Free Cash Flow (TTM) ÷ Market Cap">0.7%</span>, so the stock is not cheap on cash generation either, and that is the key reason I do not see a valuation gap large enough to justify a more aggressive rating.
On the analysis here, I would put fair value in a range of about $40–$57. That sits inside the $40.0–$57.0 analyst target range from 10 opinions, so I do not have to fight consensus to make the case; instead, I think the market is already giving Brookfield credit for the quality of the asset base. My own range is narrower than the full peer-implied spread because I weight the <span class="lf0-key" data-src="Derived calculation: (Total Debt (mrq) – Total Cash (mrq)) ÷ EBITDA (TTM)">5.9x</span> net debt to EBITDA and <span class="lf0-key" data-src="Yahoo Finance — Key Statistics (Cash Flow Statement): Levered Free Cash Flow (TTM) ÷ Revenue (TTM)">0.9%</span> FCF margin more heavily than the headline EV/EBITDA multiple.
I would also frame forward earnings as modest rather than powerful. Forward EPS of $1.18 is well below the higher-growth peers in the comparison set, which means the stock is priced more like a lower-yielding infrastructure asset than a high-earnings compounder. That is consistent with the leverage profile: the business can support the multiple, but only if cash conversion improves.
Valuation versus peers
| Company | Current Share Price (USD) | Trailing P/E | Forward P/E | EV/Revenue | EV/EBITDA | Price/Sales (TTM) | Price/Book (mrq) | Market Cap (USD Mil) | Enterprise Value (USD Mil) | Beta (5Y Monthly) | FCF Yield % (TTM) | Forward EPS | Analyst Target Price – Low | Analyst Target Price – Mean | Analyst Target Price – High | # Analyst Opinions |
|---|---|---|---|---|---|---|---|---|---|---|---|---|---|---|---|---|
| <span class="lf0-primary">BIP</span> | 39.9 | 285 | 33.9 | 4.2 | 10.2 | 1.2 | 4.1 | 31,597 | 108,112 | 1.03 | 0.7% | 1.2 | 40 | 46.4 | 57 | 10 |
| BIPC | 39.9 | — | 19.6 | 5.5 | 7.2 | 1.3 | -3.6 | 4,916 | 20,251 | 1.33 | 14.3% | 2 | 48 | 48 | 48 | 1 |
| CWEN | 34.8 | 45.2 | 22.1 | 11.1 | 15 | 4.5 | 2.3 | 7,140 | 17,495 | 0.82 | 5.9% | 1.6 | 32 | 40.4 | 52 | 14 |
| VST | 132.8 | 17.9 | 14 | 3.2 | 8.3 | 2.2 | 14.8 | 45,009 | 64,868 | 1.38 | — | 9.5 | 106 | 202.7 | 306 | 21 |
| SO | 94 | 21.5 | 19 | 5.9 | 12.5 | 3.5 | 2.6 | 109,417 | 184,013 | 0.29 | -4.7% | 4.9 | 74 | 96.1 | 115 | 20 |
Source: Yahoo Finance
BIP trades at 4.2x EV/Revenue and <span class="lf0-key" data-src="Yahoo Finance — Key Statistics: EV/EBITDA">10.2x</span> EV/EBITDA, versus BIPC at 5.5x and 7.2x, CWEN at 11.1x and 15.0x, VST at 3.2x and 8.3x, and SO at <span class="lf0-key" data-src="Yahoo Finance — Key Statistics">5.9x</span> and 12.5x. On a peer-multiple basis, BIP’s implied EV range from the 3.2x to 11.1x EV/Revenue span is about $19.8B to $69.8B, which translates to a wide per-share range after netting debt and cash; that spread is why I focus more on cash conversion and leverage than on the headline multiple alone.
A $1 investment a year ago would be worth 1.14 in BIP, 0.93 in BIPC, 1.02 in CWEN, 0.74 in VST, and 1.05 in SO, so BIP has outperformed most of the group on a one-year basis. That outperformance helps explain why the stock does not screen as obviously cheap, even though the underlying business is still more stable than the faster-growing names.
<a id="lf0-leverage"></a>
Leverage
Brookfield Infrastructure Partners carries total debt to equity of 202.5% and total debt of $65.3B, with a current ratio of 0.8, so the balance sheet is levered and the near-term liquidity cushion is thin. Operating cash flow is <span class="lf0-key" data-src="Yahoo Finance — Key Statistics (Cash Flow Statement): Operating Cash Flow (TTM)">$6B</span> TTM and levered free cash flow is $232.2M TTM, which means EBITDA is not translating cleanly into residual cash after interest and capital spending.
Net debt to EBITDA of <span class="lf0-key" data-src="Derived calculation: (Total Debt (mrq) – Total Cash (mrq)) ÷ EBITDA (TTM)">5.9x</span> and FCF margin of <span class="lf0-key" data-src="Yahoo Finance — Key Statistics (Cash Flow Statement): Levered Free Cash Flow (TTM) ÷ Revenue (TTM)">0.9%</span> point to meaningful refinancing sensitivity, especially if rates stay elevated or asset-level cash flow softens. In my view, this is a medium-to-high refinancing risk because the business still generates cash, but the low current ratio and modest free cash flow leave limited room for error before the next refinancing window becomes a real issue.
Leverage versus peers
| Company | Total Debt/Equity % (mrq) | Current Ratio (mrq) | Total Debt (mrq, USD Mil) | Free Cash Flow TTM (USD Mil) | Net Debt/EBITDA (TTM) | FCF Margin % (TTM) |
|---|---|---|---|---|---|---|
| <span class="lf0-primary">BIP</span> | 202.5 | 0.8 | 65,304 | 232.2 | 5.9 | 0.9% |
| BIPC | 681.7 | 0.4 | 12,700 | 701 | 4.3 | 19.0% |
| CWEN | 176.9 | 1.2 | 9,901 | 421.8 | 8.2 | 26.8% |
| VST | 373.3 | — | 20,508 | — | 2.6 | — |
| SO | 168.5 | 0.8 | 75,495 | -5,089.6 | 5 | -16.3% |
Source: Yahoo Finance
BIP’s total debt to equity of 202.5% and net debt to EBITDA of <span class="lf0-key" data-src="Derived calculation: (Total Debt (mrq) – Total Cash (mrq)) ÷ EBITDA (TTM)">5.9x</span> are heavier than CWEN’s 176.9% and 8.2x, SO’s 168.5% and 5.0x, and VST’s 373.3% and 2.6x, while BIPC’s 681.7% debt to equity and 4.3x net debt to EBITDA show how much of its capital structure is equity-light. BIP’s <span class="lf0-key" data-src="Yahoo Finance — Key Statistics (Cash Flow Statement): Levered Free Cash Flow (TTM) ÷ Revenue (TTM)">0.9%</span> FCF margin is also thin versus BIPC’s 19.0% and CWEN’s 26.8%, so the balance sheet is a financing choice that supports asset ownership but leaves less room for error if cash conversion weakens.
<a id="lf0-insiders"></a>
Insider Activity
The insider transaction record I see here is one-sided: one open-market purchase for $55,315 and no open-market sales in the 2026-05-01 window. The purchase was 1,150 shares at $48.10 by Krant David Tyler, Chief Financial Officer, which is a modest but positive signal of alignment.
<a id="lf0-conclusion"></a>
Conclusion
I would put my rating as a Hold because Brookfield Infrastructure Partners combines a durable, contracted cash flow base with a valuation and leverage profile that already reflect much of that quality. The business has 90.0% of adjusted EBITDA tied to regulated or contractual revenues, but the stock still trades at <span class="lf0-key" data-src="Yahoo Finance — Key Statistics: EV/EBITDA">10.2x</span> EV/EBITDA and only a <span class="lf0-key" data-src="Derived calculation: Levered Free Cash Flow (TTM) ÷ Market Cap">0.7%</span> FCF yield, so investors are paying for stability without getting much cash return today.
The key tension is whether the acquisition-led growth strategy is improving cash conversion fast enough to offset the heavier balance sheet. Right now, I do not see that in the numbers: operating cash flow is <span class="lf0-key" data-src="Yahoo Finance — Key Statistics (Cash Flow Statement): Operating Cash Flow (TTM)">$6B</span>, but levered free cash flow is only $232.2M and net debt to EBITDA is <span class="lf0-key" data-src="Derived calculation: (Total Debt (mrq) – Total Cash (mrq)) ÷ EBITDA (TTM)">5.9x</span>, which tells me the partnership is still using a lot of its cash engine to support capital intensity and financing costs.
I would raise my rating more towards a Buy if free cash flow margin moved materially above <span class="lf0-key" data-src="Yahoo Finance — Key Statistics (Cash Flow Statement): Levered Free Cash Flow (TTM) ÷ Revenue (TTM)">0.9%</span> and the acquisition wave proved it could convert into cleaner cash generation rather than just larger reported EBITDA. A move to a positive step-up in free cash flow, meaning several hundred million dollars more annual residual cash on the current revenue base, would tell me the leverage burden is becoming easier to carry and that distribution growth is being funded by real cash rather than balance-sheet stretch.
I would move from Hold to Sell if net debt to EBITDA stayed near <span class="lf0-key" data-src="Derived calculation: (Total Debt (mrq) – Total Cash (mrq)) ÷ EBITDA (TTM)">5.9x</span> while operating cash flow stopped covering the interest and acquisition load with the same comfort it does today. The risk is not a near-term liquidity event, but a slower erosion of flexibility if integration costs, valuation marks, or higher rates keep the current ratio at 0.8 and leave free cash flow stuck near the current <span class="lf0-key" data-src="Yahoo Finance — Key Statistics (Cash Flow Statement): Levered Free Cash Flow (TTM) ÷ Revenue (TTM)">0.9%</span> margin.
Weighing both cases, I lean to the bull side on asset quality but not enough to pay up for it today. The contracted portfolio and capital recycling engine are real, yet the current multiple already gives Brookfield credit for that durability, so I would wait for clearer cash conversion before moving off Hold.
What to Watch Next
- Free cash flow margin above <span class="lf0-key" data-src="Yahoo Finance — Key Statistics (Cash Flow Statement): Levered Free Cash Flow (TTM) ÷ Revenue (TTM)">0.9%</span> — would support a move toward Buy.
- Net debt to EBITDA staying near <span class="lf0-key" data-src="Derived calculation: (Total Debt (mrq) – Total Cash (mrq)) ÷ EBITDA (TTM)">5.9x</span> — would keep leverage a constraint.
- Operating cash flow versus interest and acquisition costs — would show whether cash coverage is improving.
- Integration of Colonial, Hotwire, and Wells Fargo Rail — would test whether acquisitions are adding cash, not just assets.
- Current ratio near 0.8 — a further drop would tighten liquidity flexibility.
What’s your take? I rated Brookfield Infrastructure Partners (BIP) HOLD above — but the goal here is to get this right, not just to publish an opinion. What would you add to this analysis, or which risk or catalyst do you think I’m under- or over-weighting? Tell me in the comments.
Our track record: every directional call is tracked publicly on The Scorecard, and Stocks Covered lists every company we have rated and when.
Sources
Data sourced from Yahoo Finance and SEC EDGAR. Not investment advice.
Leave a Comment