Expected price range
Each range is set from the stock’s recent price history and our Hold rating, using its own 1-year realised volatility (63% annualised) as the width of a ~68% statistical band, and checked against that rating so the range leans the same way as our view. Starting price $34.93 (close 2026-11-02). The stock traded between $31.42 and $68.77 over the last 6 months and between $26.19 and $68.77 over the last year. This is an illustration of where our view and normal volatility point, not a forecast, price target or investment advice; the stock can move outside it.
| Company | Nov 25 | Dec 25 | Jan 26 | Feb 26 | Mar 26 | Apr 26 | May 26 | Jun 26 | Jul 26 | Aug 26 | Sep 26 | Oct 26 | 12-Mo |
|---|---|---|---|---|---|---|---|---|---|---|---|---|---|
| CENX | +1% | +31% | +16% | +14% | +14% | +1% | +11% | -30% | -3% | +2% | -21% | -6% | +14% |
| AA | +14% | +27% | +7% | +9% | +7% | -4% | +22% | -33% | -13% | +11% | -16% | -6% | +8% |
| KALU | +6% | +20% | +7% | +6% | -7% | +42% | +7% | +7% | -18% | -1% | -9% | -19% | +31% |
| CSTM | +7% | +12% | +19% | +11% | -1% | +27% | +10% | -7% | -13% | -5% | -8% | -4% | +47% |
| MT | +14% | +6% | +18% | +21% | -20% | +10% | +22% | -13% | +16% | +7% | -11% | -10% | +59% |
| GGB | +3% | +3% | +16% | -5% | -10% | +27% | -1% | -10% | +23% | -6% | +2% | -1% | +37% |
Source: Yahoo Finance monthly adjusted close.
Quick Thesis
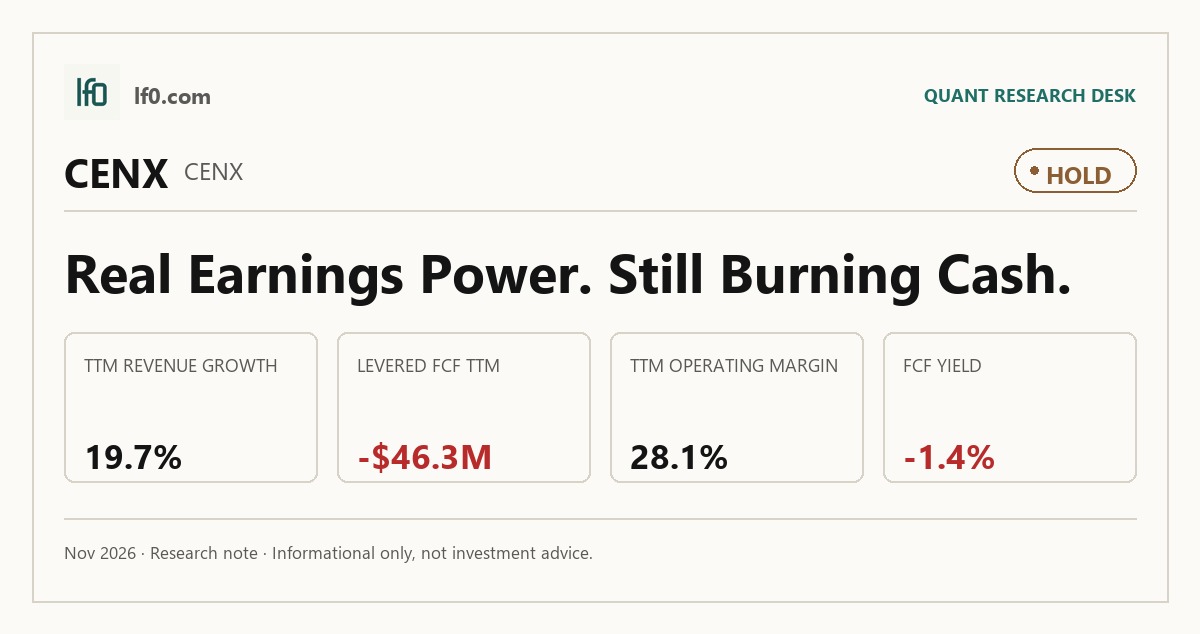
- Rated Hold — earnings have inflected, but cash conversion has not.
- Strongest strength: TTM operating margin of 28.1% with net debt/EBITDA at 0.3x.
- Biggest risk: levered free cash flow was -$46.3M TTM.
- Valuation is mixed: 1.4x EV/revenue and 7.5x EV/EBITDA are not cheap for a cyclical producer.
- I would move toward Buy if free cash flow turns positive and stays there for two quarters.
Executive Summary
Rating: HOLD | CENX
We’ll begin tracking this call’s performance since publication once sufficient adjusted-close data is available.
I would put my rating as a Hold because Century Aluminum’s latest earnings step-up is real, but the stock already discounts a good part of that improvement while cash conversion remains negative. Revenue rose to $752M in Q2 2026 and EBITDA reached $284M, yet levered free cash flow was still -$46.3M TTM, so the equity is not yet self-funding in the way I would want before paying for a cleaner rerating. The balance sheet is not the issue — net debt/EBITDA is only 0.3x — but the market is already paying 1.4x EV/revenue for a cyclical producer whose profit recovery still needs to prove itself in cash.
I would raise my rating more toward a Buy if free cash flow turns positive and stays there for two quarters, because that would show the earnings inflection is translating into cash rather than being absorbed by working capital or capex. If quarterly revenue can hold above $750M while EBITDA remains in the $280M–$360M range, the current multiple would start to look too low for the margin profile.
Company Profile
Century Aluminum is a primary aluminum producer that sells metal and alumina under contracts priced off the London Metal Exchange and regional premiums, with revenue recognized on shipment or delivery. It operates one reportable segment across Sebree in Kentucky, Mt. Holly in South Carolina, Grundartangi in Iceland, a 55% interest in Jamalco in Jamaica, and Vlissingen in the Netherlands. The company went public in 1996 and has since added Jamalco, issued $400M of 6.875% senior secured notes due 2032, and sold Hawesville in February 2026 for $200M. As of December 31, 2025, Glencore owned 36.4% of the common stock, and Century had $480M of debt, $134.2M of cash, and a $250M revolving credit facility.
Economic Moat
Business Model
Power supply is the most defensible part of Century Aluminum’s model because the smelters sit on long-term contracts that tie a large share of electricity to market formulas rather than fully exposed spot pricing. Grundartangi is supplied by hydroelectric and geothermal sources under agreements with HS, Landsvirkjun, and OR that run from 2026 through 2036, and the larger Landsvirkjun contract combines a fixed rate with an LME-linked variable rate. I feel that is hard for a competitor to copy quickly because it requires both the right geography and the right contract structure, not just capital. The company also has a natural hedge: certain alumina contracts and a substantial portion of Grundartangi’s power requirements are indexed to primary aluminum prices, which softens some commodity swings. That said, the filing shows power price sensitivity of $15.9M for a $1 per MWh move across the portfolio, so the moat is real but not absolute.
Business & Operating Risks
The main disclosed risk is that Century cannot fully pass higher production costs through to customers, and power remains one of its largest operating costs. A $1 per MWh move changes annual power cost by $15.9M across Sebree, Mt. Holly, and Grundartangi, so the earnings base is exposed to utility pricing even with the long-term contracts in place. Jamalco adds a second layer of risk because the company disclosed a material weakness tied to controls at that joint venture, and the 2025 filing says the weakness remained unremediated at December 31, 2025. Glencore concentration is also material: it accounted for 54.0% of consolidated sales in 2025, which leaves Century vulnerable to any reset in that relationship. The disclosed risks do not break the moat, but they do show that the power-cost advantage can be eroded if commodity and counterparty conditions move against the company.
Management Discussion & Analysis
Management appears to be responding to the balance-sheet and portfolio issues through asset recycling, but the current MD&A excerpt does not give me enough to judge a broader capital-allocation plan. The Hawesville sale and the senior notes issuance both point to a more deliberate liquidity posture, while the Jamalco control issue remains unresolved as of the filing date. In my view, that means management is addressing the financing side of the risk set, but not yet the reporting-quality issue.
Recent Events
The February 2, 2026 sale of Hawesville for $200M in cash plus a 6.8% minority interest in a planned data-center project is the clearest recent strategic move. Century kept no financing, construction, or operating obligations, so this looks like capital recycling that strengthens liquidity without adding execution risk. The March 2, 2026 Jamalco accounting change is less constructive: prior financial statements for 2023 through Q3 2025 will be restated, which raises the bar for confidence in reported balances even if it does not change net income attributable to Century stockholders. The recent 8-Ks therefore support the moat thesis on liquidity and portfolio simplification, but they also show that reporting quality still needs work.
Financial Analysis
Growth
CENX — Financial Growth (Quarterly, USD Mil)
| Metric | 2025-06-30 | 2025-09-30 | 2025-12-31 | 2026-03-31 | 2026-06-30 |
|---|---|---|---|---|---|
| REVENUE (USD Mil) | 628.1 | 632.2 | 633.7 | 649.2 | 752.1 |
| EBIT (USD Mil) | -1.3 | 22.5 | -12.5 | 339.3 | 267 |
| EBITDA (USD Mil) | 22 | 36.8 | 17.7 | 362 | 283.9 |
| NET INCOME (USD Mil) | -4.6 | 14.9 | 1.8 | 337.5 | 249.3 |
| DILUTED EPS | -0.1 | 0.1 | 0 | 3.2 | 2.4 |
Source: Yahoo Finance — Quarterly Financial Statements
Revenue rose from $628M in Q2 2025 to $752M in Q2 2026, with the real inflection arriving in the last two quarters rather than through a steady climb. EBITDA jumped to $362M in Q1 2026 from $17.7M in Q4 2025, then remained strong at $284M in Q2 2026, which tells me the business is now earning materially more from the same asset base. That step-up is consistent with the stronger pricing and operating leverage the moat discussion points to, but it also means the equity is more exposed to a reversal if aluminum or power pricing softens.
Profitability
CENX — Profitability (TTM)
| Metric | TTM |
|---|---|
| Operating Margin (TTM) | 28.1% |
| Net Margin (TTM) | 22.6% |
| Return on Assets (TTM) | 10.2% |
| Return on Equity (TTM) | 51.7% |
Source: Yahoo Finance — Trailing Twelve Months (TTM)
TTM operating margin of 28.1%, gross margin of 18.9%, and EBITDA margin of 18.0% show a business that is already profitable at the operating line. Net margin of 22.6% is even higher than operating margin, which suggests below-the-line items are helping reported earnings rather than the business simply converting more revenue into operating profit. Return on assets of 10.2% and return on equity of 51.7% are both strong, but the gap between them tells me leverage is amplifying returns. I would want to see operating margin stay above 20% and net margin remain close to it, because that would confirm durable earnings quality rather than a one-off lift.
Valuation
CENX — Valuation Multiples
| Metric | Value |
|---|---|
| Current Share Price (USD) | 34.6 |
| Market Cap (USD Mil) | 3,422 |
| Enterprise Value (USD Mil) | 3,604 |
| Trailing P/E | 6 |
| Forward P/E | 3 |
| Price/Sales (TTM) | 1.3 |
| EV/Revenue | 1.4 |
| EV/EBITDA | 7.5 |
| FCF Yield % (TTM) | -1.4% |
| Forward EPS (USD) | 11.4 |
| Analyst Target Price – Low (USD) | 40 |
| Analyst Target Price – Mean (USD) | 60.2 |
| Analyst Target Price – High (USD) | 79 |
| # Analyst Opinions | 5 |
Source: Yahoo Finance
Century Aluminum trades at 1.4x EV/revenue, 7.5x EV/EBITDA, and 3x forward P/E, which is not expensive for a cyclical producer with a recent earnings inflection. At $34.6 per share, the market is paying for a business that has produced 18.0% EBITDA margin TTM but still carries -1.7% FCF margin and -$46.3M of levered free cash flow, so the multiple is fair only if the cash conversion gap closes. The company has 5 analyst opinions, with a target range of $40–$79 and a mean of $60.2; my own fair-value range is lower, at roughly $35–$50, because I weight the negative free cash flow and commodity sensitivity more heavily than the consensus appears to. On that basis, the stock sits below the analyst mean but still inside the broader consensus band, which tells me the market is not ignoring the upside, just discounting how quickly it can be monetized. Forward EPS of 11.4 is rich relative to peers on a dollar basis, but that only matters if the earnings base holds; otherwise the multiple is doing more work than the cash flow.
Leverage
CENX — Leverage & Coverage (Quarterly)
| Metric | Value |
|---|---|
| Total Debt/Equity % (mrq) | 31.3 |
| Current Ratio (mrq) | 2.8 |
| Total Debt (mrq, USD Mil) | 480 |
| Levered Free Cash Flow (TTM, USD Mil) | -46.3 |
| Net Debt/EBITDA (TTM) | 0.3 |
| FCF Margin % (TTM) | -1.7% |
Source: Yahoo Finance — Quarterly Financial Statements
Total debt was $480M in the most recent quarter, with debt/equity at 31.3% and a current ratio of 2.8x, so near-term liquidity is comfortable. Net debt/EBITDA of 0.3x is modest, which means refinancing pressure is not immediate. The weak spot is cash conversion: operating cash flow was $340.8M TTM, but levered free cash flow was -$46.3M and FCF margin was -1.7%, so working capital, capex, or financing costs are still consuming cash. That is why I see the balance sheet as supportive but not yet a reason to underwrite a higher valuation on its own.
Insider Activity
The insider transaction record is one-sided: 14 open-market sales and 0 open-market purchases in the latest window, so insiders are clearly net sellers. The activity is broad rather than isolated, with the CEO, CFO, and several other executives all selling, and the 6,315,245-share sale by Glencore International AG makes the pattern especially heavy. I read that as a cautionary signal, not a thesis breaker, because it does not change the operating numbers but it does tell me insiders are not leaning in at current levels.
Comparable Analysis
LF0 has published standalone analyses of these peers: Constellium (CSTM) (rated Hold).
Growth
| Company | Revenue TTM (USD Mil) | Revenue Growth YoY % | Diluted EPS TTM |
|---|---|---|---|
| CENX | 2,667.2 | 19.7% | 5.8 |
| AA | 14,312 | 23.7% | 5.8 |
| KALU | 4,506.9 | 44.0% | 12.9 |
| CSTM | 10,049 | 21.8% | 4.1 |
| MT | 62,846 | 5.2% | 2.4 |
| GGB | 70,251.1 | 3.9% | 0.3 |
Source: Yahoo Finance
CENX’s revenue growth of 19.7% TTM sits ahead of MT at 5.2% and GGB at 3.9%, but behind AA at 23.7%, CSTM at 21.8%, and KALU at 44.0%. That puts Century in the middle of the pack on growth, which is good enough to support a rerating only if the margin gains are durable.
Valuation
| Company | Current Share Price (USD) | Trailing P/E | Forward P/E | EV/Revenue | EV/EBITDA | Price/Sales (TTM) | Price/Book (mrq) | Market Cap (USD Mil) | Enterprise Value (USD Mil) | Beta (5Y Monthly) | FCF Yield % (TTM) | Forward EPS | Analyst Target Price – Low | Analyst Target Price – Mean | Analyst Target Price – High | # Analyst Opinions |
|---|---|---|---|---|---|---|---|---|---|---|---|---|---|---|---|---|
| CENX | 34.6 | 6 | 3 | 1.4 | 7.5 | 1.3 | 2.4 | 3,422 | 3,604 | 2.18 | -1.4% | 11.4 | 40 | 60.2 | 79 | 5 |
| AA | 40.3 | 7 | 7.7 | 0.8 | 3.8 | 0.7 | 1.3 | 10,635 | 10,759 | 1.84 | 8.6% | 5.2 | 48 | 54.6 | 63 | 13 |
| KALU | 119.7 | 9.3 | 11 | 0.6 | 6.1 | 0.4 | 2 | 1,957 | 2,834 | 1.71 | 3.1% | 10.9 | 125 | 141 | 158 | 5 |
| CSTM | 23.8 | 5.8 | 8.2 | 0.5 | 4 | 0.3 | 2.4 | 3,203 | 4,775 | 1.63 | 2.5% | 2.9 | 30.2 | 33.7 | 36.2 | 6 |
| MT | 62.3 | 26.3 | 8.8 | 1.6 | 18.7 | 0.7 | 1.7 | 46,879 | 101,774 | 1.70 | -1.7% | 7.1 | 63.3 | 77.8 | 93 | 7 |
| GGB | 4.7 | 17.5 | 7.2 | 0.3 | 1.7 | 0.1 | 0.9 | 9,288 | 18,772 | 0.83 | 30.8% | 0.7 | 5 | 5.6 | 6.3 | 5 |
Source: Yahoo Finance
CENX trades at 1.4x EV/revenue and 7.5x EV/EBITDA, versus AA at 0.8x and 3.8x, KALU at 0.6x and 6.1x, CSTM at 0.5x and 4.0x, MT at 1.6x and 18.7x, and GGB at 0.3x and 1.7x. On a peer basis, Century is not the cheapest name, and the market is also paying for a 1-year total return of 9.7% that trails CSTM’s 42.5%, MT’s 58.8%, and GGB’s 37.1%. I think the valuation premium is only partly justified by the stronger margin profile, because the stock is still being priced ahead of cash conversion rather than alongside it.
Profitability
| Company | Operating Margin (TTM) | Net Margin (TTM) | Return on Assets (TTM) | Return on Equity (TTM) | Gross Margin (TTM) | EBITDA Margin (TTM) |
|---|---|---|---|---|---|---|
| CENX | 28.1% | 22.6% | 10.2% | 51.7% | 18.9% | 18.0% |
| AA | 16.0% | 10.7% | 7.5% | 20.6% | 22.8% | 20.0% |
| KALU | 4.5% | 4.8% | 7.8% | 24.5% | 13.4% | 10.3% |
| CSTM | 7.2% | 5.7% | 9.7% | 52.3% | 16.3% | 12.0% |
| MT | 6.3% | 2.9% | 1.6% | 3.3% | 9.0% | 8.7% |
| GGB | 14.4% | 3.9% | 5.8% | 5.0% | 14.7% | 15.8% |
Source: Yahoo Finance
CENX’s operating margin of 28.1%, net margin of 22.6%, ROA of 10.2%, and ROE of 51.7% all sit above AA, KALU, CSTM, MT, and GGB on the table. The gap is meaningful, but it also reflects a more leveraged equity return profile, so I would not treat the ROE alone as proof of superior operating quality. The cleaner read is that Century is one of the better margin names in the group, even if the cash flow profile does not yet match that strength.
Leverage
| Company | Total Debt/Equity % (mrq) | Current Ratio (mrq) | Total Debt (mrq, USD Mil) | Operating Cash Flow TTM (USD Mil) | Free Cash Flow TTM (USD Mil) | Net Debt/EBITDA (TTM) | FCF Margin % (TTM) |
|---|---|---|---|---|---|---|---|
| CENX | 31.3 | 2.8 | 480 | 340.8 | -46.3 | 0.3 | -1.7% |
| AA | 58.5 | 2.3 | 4,822 | 1,609 | 918.6 | 0.1 | 6.4% |
| KALU | 109.4 | 2.6 | 1,067.5 | 227.5 | 61.2 | 2.1 | 1.4% |
| CSTM | 135.5 | 1.5 | 1,817 | 638 | 78.9 | 1.4 | 0.8% |
| MT | 25.4 | 1.4 | 14,421 | 4,698 | -779.1 | 1.8 | -1.2% |
| GGB | 28.2 | 2.9 | 15,480.4 | 8,888.3 | 2,863.8 | 0.8 | 4.1% |
Source: Yahoo Finance
CENX’s debt/equity ratio of 31.3% and net debt/EBITDA of 0.3x are better than KALU’s 109.4% and 2.1x, CSTM’s 135.5% and 1.4x, and MT’s 25.4% and 1.8x, while the current ratio of 2.8x is also solid. AA and GGB convert cash better, with positive FCF margins of 6.4% and 4.1%, so Century’s lower leverage does not fully offset its weaker free cash flow. That is the key cross-check: the balance sheet is cleaner than several peers, but the market is still waiting for the cash flow to catch up.
Conclusion
I would put my rating as a Hold because the earnings inflection is visible, but the cash conversion problem has not yet been fixed. Revenue and EBITDA have stepped up sharply, and the balance sheet is still manageable at 0.3x net debt/EBITDA, yet levered free cash flow remains negative at -$46.3M TTM. That combination tells me the business is improving, but not yet improving in the way that would justify paying up aggressively.
I would move more toward a Buy if free cash flow turns positive and stays there for two quarters, because that would show the recent EBITDA strength is reaching equity holders rather than being absorbed by working capital or capex. I would also want quarterly revenue to hold above $750M, meaning the step-up is durable rather than a one-quarter spike, while EBITDA stays in the $280M–$360M range. If those conditions hold, the current 1.4x EV/revenue multiple would start to look too low for a business with this margin profile.
The bear case is that the Q2 2026 revenue jump proves temporary and EBITDA falls back toward the sub-$20M level seen in Q4 2025. A $1 per MWh adverse move still changes annual power cost by $15.9M, so the earnings base can weaken quickly if commodity and utility conditions turn. If that happens while free cash flow stays negative, the stock would look more like a cyclical peak than a rerating candidate.
For now, I think the stronger case is that the earnings inflection holds, but I do not yet see enough evidence to pay for it as if it were permanent. The next quarter that matters is the one that shows profit turning into cash.
What to Watch Next
- Free cash flow turning positive for two straight quarters — would support a move toward Buy.
- Quarterly revenue staying above $750M — would confirm the step-up is durable.
- EBITDA holding in the $280M–$360M range — would support the current margin reset.
- Power cost sensitivity of $15.9M per $1/MWh — a useful stress test for earnings durability.
- Net debt/EBITDA staying near 0.3x — would keep refinancing risk contained.
What’s your take? I rated Century Aluminum (CENX) HOLD above — but the goal here is to get this right, not just to publish an opinion. What would you add to this analysis, or which risk or catalyst do you think I’m under- or over-weighting? Tell me in the comments.
Our track record: every directional call is tracked publicly on The Scorecard, and Stocks Covered lists every company we have rated and when.
Sources
- SEC 10-K Annual Report — filed 2026-03-03
- SEC 8-K Filing (2026-05-07)
- SEC 8-K Filing (2026-03-03)
- SEC 8-K Filing (2026-02-19)
- SEC 8-K Filing (2026-02-02)
- SEC Form 4 Insider Transaction (2026-03-27)
- SEC Form 4 Insider Transaction (2026-03-17)
- SEC Form 4 Insider Transaction (2026-03-13)
- SEC 10-K Annual Report — FY2026
- SEC 10-K Annual Report — FY2025
- SEC 10-K Annual Report — FY2024
- SEC 10-K Annual Report — FY2023
- SEC 10-K Annual Report — FY2022
Data sourced from Yahoo Finance and SEC EDGAR. Not investment advice.
Leave a Comment