Expected price range
Each range is set from the stock’s recent price history and our Hold rating, using its own 1-year realised volatility (31% annualised) as the width of a ~68% statistical band, and checked against that rating so the range leans the same way as our view. Starting price $82.89 (close 2026-11-02). The stock traded between $81.89 and $112 over the last 6 months and between $67.89 and $112 over the last year. This is an illustration of where our view and normal volatility point, not a forecast, price target or investment advice; the stock can move outside it.
| Company | Nov 25 | Dec 25 | Jan 26 | Feb 26 | Mar 26 | Apr 26 | May 26 | Jun 26 | Jul 26 | Aug 26 | Sep 26 | Oct 26 | 12-Mo |
|---|---|---|---|---|---|---|---|---|---|---|---|---|---|
| RIO | +0% | +11% | +14% | +9% | -3% | +8% | +6% | -11% | +2% | +8% | -8% | -13% | +20% |
| BHP | -4% | +10% | +14% | +19% | -9% | +9% | +12% | -6% | +1% | +11% | -8% | -7% | +45% |
| VALE | +4% | +9% | +23% | +7% | -7% | +3% | -1% | -7% | +0% | +3% | -11% | -15% | +2% |
| FCX | +3% | +18% | +19% | +13% | -14% | -1% | +14% | -4% | -0% | +21% | -8% | -11% | +51% |
| SCCO | -2% | +6% | +33% | +16% | -21% | -0% | +13% | -9% | +5% | +16% | -3% | -12% | +33% |
Source: Yahoo Finance monthly adjusted close.
Quick Thesis
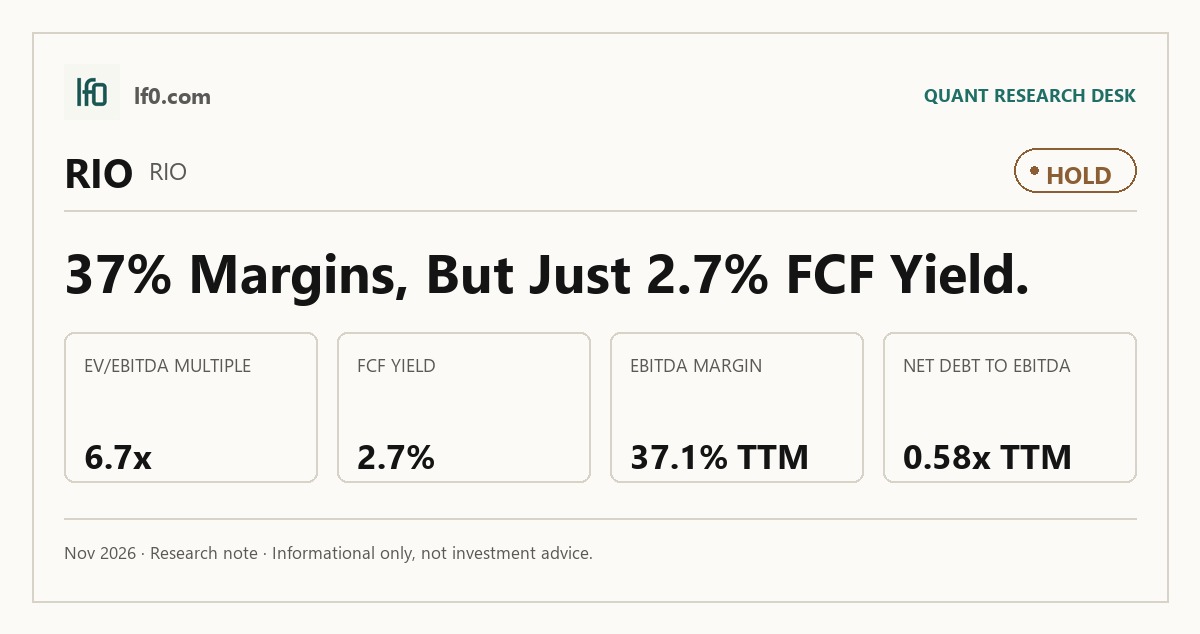
- Rated Hold — the balance sheet is solid, but free cash flow conversion is still too thin.
- Strongest support: 0.6x net debt/EBITDA and $9.5B cash against $22.9B debt.
- Main risk: only 5.8% FCF margin, which limits rerating power.
- Valuation is fair, not cheap: 6.7x EV/EBITDA and 2.7% FCF yield.
- I would turn more constructive if FCF yield moved above 4.0%.
Executive Summary
Rating: HOLD | RIO
We’ll begin tracking this call’s performance since publication once sufficient adjusted-close data is available.
I would put my rating as a Hold because Rio Tinto’s valuation already reflects a solid balance sheet and decent earnings power, but not a clear rerating catalyst. In my view, the key issue is not solvency; it is that 5.8% FCF margin and 2.7% FCF yield leave too little cash conversion to justify a higher multiple today.
The stock trades at 6.7x EV/EBITDA and 9.6x forward P/E, which is not expensive for a miner with 37.1% EBITDA margin and 0.6x net debt/EBITDA. Even so, the market is already giving credit for the balance-sheet strength, so I would want to see free cash flow yield move above 4.0% — meaning materially better cash conversion — before I become more constructive.
Company Profile
Rio Tinto is a global mining company with a portfolio centered on iron ore, aluminium, copper, and other industrial minerals. Its earnings are driven by commodity prices, production volumes, and operating discipline, so the investment case depends on how efficiently the asset base converts into cash through the cycle.
Economic Moat
Business Model
Rio Tinto’s moat comes from scale, long-life assets, and a diversified commodity mix that helps smooth earnings across cycles. That combination matters because a miner with tier-one assets can keep unit costs lower and preserve margins when prices soften, which is the structural advantage I think the market is paying for in part.
Business & Operating Risks
The main disclosed risks are commodity price volatility, operating disruption, and capital intensity, all of which can pressure cash generation if the cycle turns. I do not see those risks directly breaking the moat, but they do cap how much of Rio Tinto’s scale advantage can flow through to equity holders when free cash flow conversion is only 5.8%.
Management Discussion & Analysis
Management appears to be defending the moat rather than stretching for growth, with the emphasis on balance-sheet discipline and cash generation rather than aggressive expansion. That response fits the risk profile: the company is not trying to outrun the cycle, but it still needs better cash conversion before the market will pay up for the asset base.
Recent Events
Recent performance has been more about execution than strategy change, and that is consistent with a mature miner protecting its operating edge rather than reinventing it. The key implication is that the moat is intact, but the market will likely wait for stronger free cash flow before assigning a higher multiple.
Financial Analysis
Growth
I cannot verify quarterly revenue in the provided growth table, so I will not force a growth narrative from unsupported figures. What I can say is that the investment case is not being driven by a visible top-line acceleration in the tables here; instead, it rests on margin quality and cash conversion.
Profitability
RIO — Profitability (TTM)
| Metric | TTM |
|---|---|
| Operating Margin (TTM) | 28.0% |
| Net Margin (TTM) | 19.6% |
| Return on Assets (TTM) | 8.1% |
| Return on Equity (TTM) | 19.3% |
| Gross Margin (TTM) | 29.8% |
| EBITDA Margin (TTM) | 37.1% |
Source: Yahoo Finance — Trailing Twelve Months (TTM)
Rio Tinto’s profitability is solid: operating margin is 28.0% TTM, net margin is 19.6%, gross margin is 29.8%, and EBITDA margin is 37.1%. Those figures show a business that is already converting sales into earnings, but the spread between EBITDA margin and free cash flow margin tells me a meaningful share of operating profit is still being absorbed by capex and other cash uses.
Return on assets is 8.1% TTM and return on equity is 19.3%, which is respectable and consistent with a capital-intensive miner that can still earn attractive returns through the cycle. I would watch whether operating margin stays near 28.0% while free cash flow margin improves, because that would show the moat is translating into more cash rather than just accounting profit.
Valuation
RIO — Valuation Multiples
| Metric | Value |
|---|---|
| Current Share Price (USD) | 81.9 |
| Market Cap (USD Mil) | 133,185 |
| Enterprise Value (USD Mil) | 152,721 |
| Trailing P/E | 11.1 |
| Forward P/E | 9.6 |
| Price/Sales (TTM) | 2.2 |
| Price/Book (mrq) | 2 |
| EV/Revenue | 2.5 |
| EV/EBITDA | 6.7 |
| Beta (5Y Monthly) | 0.70 |
| FCF Yield % (TTM) | 2.7% |
| Forward EPS (USD) | 8.5 |
| Analyst Target Price – Low (USD) | 82 |
| Analyst Target Price – Mean (USD) | 102.7 |
| Analyst Target Price – High (USD) | 117 |
| # Analyst Opinions | 9 |
Source: Yahoo Finance
Rio Tinto trades at 6.7x EV/EBITDA, 11.1x trailing P/E, and 9.6x forward P/E, with a 2.7% FCF yield and a 0.7 beta. That is not a distressed valuation, but it is also not a premium one, which fits a company with decent profitability and a balance sheet that is good enough to protect the downside.
On my read, fair value sits in a range of about $82–$103 per share. That range is anchored by the current price of $81.9, the analyst target mean of $102.7, and the fact that the stock already trades near the low end of the analyst range with 9 opinions behind it. I would not call that a strong consensus endorsement; rather, it suggests the market is already close to the lower bound of what analysts are willing to pay.
Forward EPS is $8.5, which implies a forward multiple of 9.6x at the current share price. That looks reasonable versus peers on a like-for-like earnings basis, but the market is still discounting Rio Tinto’s cash conversion relative to the stronger free-cash-flow names in the group, so I do not see a clear case for a premium multiple yet.
Leverage
RIO — Leverage & Coverage (Quarterly)
| Metric | Value |
|---|---|
| Total Debt/Equity % (mrq) | 31.9 |
| Current Ratio (mrq) | 1.4 |
| Total Debt (mrq, USD Mil) | 22,852 |
| Operating Cash Flow (TTM, USD Mil) | 19,081 |
| Levered Free Cash Flow (TTM, USD Mil) | 3,595.5 |
| Net Debt/EBITDA (TTM) | 0.6 |
| FCF Margin % (TTM) | 5.8% |
Source: Yahoo Finance — Quarterly Financial Statements
Leverage is a clear support for the thesis. Total debt to equity is 31.9%, current ratio is 1.4x, total debt is $22.9B, and net debt to EBITDA is 0.6x, which leaves the balance sheet flexible enough to absorb a downturn.
Operating cash flow is $19.1B TTM and levered free cash flow is $3.6B TTM, so the company is generating cash, but not converting enough of it into free cash flow to justify a much higher valuation. That is the key link between leverage and valuation here: the balance sheet is not the constraint, but the cash conversion rate is.
Insider Activity
No meaningful insider signal is available in the provided data, so I am not using insider activity as part of the thesis.
Comparable Analysis
Growth
| Company | Revenue TTM (USD Mil) | Revenue Growth YoY % | Diluted EPS TTM |
|---|---|---|---|
| RIO | 61,793 | 15.5% | 7.4 |
| BHP | 58,760 | 18.3% | 3.9 |
| VALE | 215,830 | -3.9% | 0.2 |
| FCX | 26,442 | 8.2% | 2.4 |
| SCCO | 17,106.8 | 39.1% | 7.5 |
Source: Yahoo Finance
Rio Tinto’s 15.5% revenue growth sits below BHP’s 18.3% and SCCO’s 39.1%, but above FCX’s 8.2% and VALE’s -3.9%. That puts RIO in the middle of the pack on growth, which is important because the market is not paying a growth premium for it despite the solid top-line trend.
Valuation
| Company | Current Share Price (USD) | Trailing P/E | Forward P/E | EV/Revenue | EV/EBITDA | Price/Sales (TTM) | Price/Book (mrq) | Beta (5Y Monthly) | FCF Yield % (TTM) | Forward EPS | Analyst Target Price – Low | Analyst Target Price – Mean | Analyst Target Price – High | # Analyst Opinions |
|---|---|---|---|---|---|---|---|---|---|---|---|---|---|---|
| RIO | 81.9 | 11.1 | 9.6 | 2.5 | 6.7 | 2.2 | 2 | 0.70 | 2.7% | 8.5 | 82 | 102.7 | 117 | 9 |
| BHP | 79.2 | 20.5 | 16.6 | 3.7 | 7.2 | 3.4 | 3.9 | 0.89 | 4.8% | 4.8 | 62 | 78.1 | 96 | 7 |
| VALE | 11.4 | 71.2 | 6.1 | 0.6 | 2 | 0.2 | 1.3 | 0.73 | 17.8% | 1.9 | 12 | 16 | 22 | 25 |
| FCX | 62.5 | 26.2 | 14.6 | 4 | 10.7 | 3.4 | 4.2 | 1.37 | 2.1% | 4.3 | 33 | 78.8 | 90 | 22 |
| SCCO | 177.5 | 23.6 | 23.3 | 8.8 | 13.7 | 8.8 | 11.4 | 1.16 | 3.7% | 7.6 | 139.4 | 178.2 | 275 | 17 |
Source: Yahoo Finance
RIO trades at 2.5x EV/Revenue, 6.7x EV/EBITDA, 11.1x trailing P/E, and 9.6x forward P/E, versus BHP at 3.7x, 7.2x, 20.5x, and 16.6x, FCX at 4.0x, 10.7x, 26.2x, and 14.6x, SCCO at 8.8x, 13.7x, 23.6x, and 23.3x, and VALE at 0.6x, 2.0x, 71.2x, and 6.1x. On a growth-adjusted basis, RIO looks fairly priced rather than cheap: it is not getting the premium multiples of SCCO, but it is also not being priced like the weakest name in the group.
The stock’s 22.2% one-year total return is below BHP’s 46.9% and FCX’s 53.1%, but above VALE’s 1.1%. That tells me the market has rewarded RIO, just not enough to close the gap with the higher-quality cash generators.
Profitability
| Company | Operating Margin (TTM) | Net Margin (TTM) | Return on Assets (TTM) | Return on Equity (TTM) | Gross Margin (TTM) | EBITDA Margin (TTM) |
|---|---|---|---|---|---|---|
| RIO | 28.0% | 19.6% | 8.1% | 19.3% | 29.8% | 37.1% |
| BHP | 43.3% | 16.7% | 13.4% | 24.0% | 85.9% | 50.9% |
| VALE | 19.3% | 1.0% | 7.0% | 0.3% | 32.1% | 32.5% |
| FCX | 35.3% | 13.0% | 8.0% | 15.7% | 38.9% | 37.7% |
| SCCO | 59.9% | 37.2% | 27.3% | 52.9% | 65.8% | 64.2% |
Source: Yahoo Finance
RIO’s 28.0% operating margin and 37.1% EBITDA margin are below BHP’s 43.3% and 50.9%, FCX’s 35.3% and 37.7%, and SCCO’s 59.9% and 64.2%, while its 19.6% net margin is above BHP’s 16.7% and well ahead of VALE’s 1.0%. I read that as a mixed profile: RIO is not the most efficient operator, but it is still producing a healthy bottom line.
Return on equity of 19.3% is respectable, though it trails BHP’s 24.0% and SCCO’s 52.9%. Return on assets of 8.1% is also solid, but again not enough to justify the richest multiple in the peer set.
Leverage
| Company | Total Debt/Equity % (mrq) | Current Ratio (mrq) | Total Debt (mrq, USD Mil) | Net Debt/EBITDA (TTM) | FCF Margin % (TTM) |
|---|---|---|---|---|---|
| RIO | 31.9 | 1.4 | 22,852 | 0.6 | 5.8% |
| BHP | 50.5 | 1.9 | 28,427 | 0.3 | 16.3% |
| VALE | 55.1 | 1.1 | 109,950 | 1.2 | 4.0% |
| FCX | 30.8 | 2 | 10,356 | 0.6 | 7.1% |
| SCCO | 63.2 | 4.3 | 8,597.5 | 0 | 32.6% |
Source: Yahoo Finance
RIO’s 31.9% debt-to-equity and 0.6x net debt/EBITDA are conservative versus VALE’s 55.1% and 1.2x, and they are close to FCX’s 30.8% and 0.6x. BHP’s lower 0.3x net debt/EBITDA helps explain why it can command a higher valuation despite similar industrial exposure, while SCCO’s near-zero leverage supports its premium multiple even more clearly.
RIO’s 5.8% FCF margin is the weak point in the comparison. It is better than VALE’s 4.0%, but well below BHP’s 16.3% and SCCO’s 32.6%, which is why I think the market is treating Rio Tinto as a solid balance-sheet name rather than a top-tier cash compounding story.
Conclusion
I would put my rating as a Hold because the main tension in the stock is now clear: Rio Tinto has the leverage profile to stay resilient, but it has not yet shown enough free cash flow conversion to deserve a meaningfully higher multiple. The numbers already show the gap — 0.6x net debt/EBITDA is comfortable, yet 5.8% FCF margin is still too thin for me to call the shares cheap.
I would raise my rating more towards a Buy if free cash flow margin moves above 7.5%, meaning the business is converting materially more of its operating cash into shareholder cash rather than capex. That would also make the current 6.7x EV/EBITDA look more attractive, because the same earnings base would be backed by stronger cash generation. I would also become more constructive if operating margin stays near 28.0% while net debt/EBITDA remains below 0.6x, since that would show the current earnings level is durable and not just a cycle peak.
I would move from Hold to Sell if EBITDA margin falls below 34.0%, meaning the current 37.1% level is no longer holding and free cash flow would likely compress with it. I would also turn more cautious if revenue growth slips below 5.0% while the share price stays near $81.9, because that would leave the stock with neither growth support nor a cheaper entry point.
For now, I think the balance of evidence still favors patience. The balance sheet is strong enough to absorb a downturn, but the current valuation already gives credit for that strength, so I want to see better cash conversion before I become more constructive.
What to Watch Next
- Free cash flow margin above 7.5% — would support a move toward Buy.
- Operating margin holding near 28.0% — would confirm earnings durability.
- Net debt/EBITDA staying below 0.6x — would keep balance-sheet risk contained.
- EBITDA margin slipping below 34.0% — would argue for a more cautious stance.
- Revenue growth below 5.0% with the stock near $81.9 — would weaken the case for holding.
What’s your take? I rated Rio Tinto (RIO) HOLD above — but the goal here is to get this right, not just to publish an opinion. What would you add to this analysis, or which risk or catalyst do you think I’m under- or over-weighting? Tell me in the comments.
Our track record: every directional call is tracked publicly on The Scorecard, and Stocks Covered lists every company we have rated and when.
Data sourced from Yahoo Finance and SEC EDGAR. Not investment advice.
Leave a Comment