The Short Version
1-800-FLOWERS.COM is a Penny Stock in Consumer Cyclical, and the short side is crowded. Short selling means borrowing shares and selling them now, hoping to buy them back later at a lower price. Here, 7.82M shares are sold short out of 9.91M shares in the float, the shares free to trade, so about 79 out of every 100 free shares have been borrowed and sold.⁽¹⁾
That is unusual because the stock is shorted more heavily than about 97% of listed stocks, and its days to cover, the time it would take shorts to buy back shares using normal trading volume, is more stretched than about 98% of stocks.⁽¹⁾
A squeeze would need buyers to keep pushing the price up while volume stays strong, because shorts can only cover by buying shares back. But the bear case is real: the company has debt, the stock has already been weak, and there is no clear catalyst in the headlines we found.⁽²⁾⁽³⁾
Our read is simple: this is a crowded short with real squeeze fuel, but without a fresh trigger the setup can sit there for a while.⁽¹⁾⁽²⁾
Squeeze Scorecard
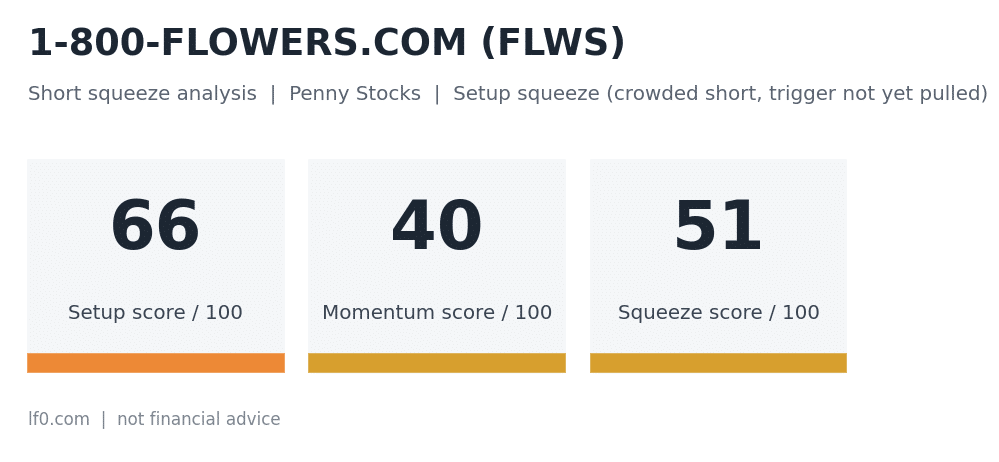
1-800-FLOWERS.COM (FLWS) | Penny Stocks | Setup squeeze (crowded short, trigger not yet pulled)
| Score | Value | Reading | What it measures |
|---|---|---|---|
| Setup Score | 66 / 100 | strong | How crowded and fragile the bet against the stock is |
| Momentum Score | 40 / 100 | moderate | Whether price and volume are already forcing short sellers to react |
| Squeeze Score | 51 / 100 | moderate | Both together, reduced for dilution and cash risks |
Prices as of 2026-10-16; short interest as of the 2026-09-30 report.
How to read the scorecard
We give every stock three scores out of 100. Setup asks: how crowded is the bet against this stock, and how hard would it be for the people betting against it to get out? Momentum asks: is something already happening, with price rising on unusually heavy trading? Squeeze combines the two. It needs both, because a crowded short with nothing happening can sit for months, and a price spike with no crowded short is just a spike.
Rough guide: 0 to 30 weak, 30 to 55 moderate, 55 to 75 strong, 75 and above extreme. Most stocks score under 30 on both.
| Low Momentum | High Momentum | |
|---|---|---|
| High Setup | Loaded spring: crowded short, trigger not yet pulled | Squeeze underway |
| Low Setup | Nothing to see | Price spike without a crowded short: often fades |
This stock: Setup 66 (strong), Momentum 40 (moderate), Squeeze 51 (moderate). Of the 3,194 stocks we scanned, this one ranked #1 on Squeeze Score. In plain terms, the bet against the stock is crowded and fragile (the spring is loaded), but price and volume have not yet forced anyone to react (the spring has not been released).
Key data
| Metric | Value |
|---|---|
| Share price (latest close) | $2.75 |
| Market value of the company | $176.5M |
| Float (shares free to trade) | 9.91M |
| Shares sold short | 7.82M |
| Short interest as % of float | 79.0% |
| Days to cover | 15.37 |
| Cost to borrow the shares (per year) | 1.45% |
| Shares still available to borrow | 100,000 |
| Latest volume vs usual | 9.1x |
| Price change over 5 trading days | 1.9% |
Executive Summary
We are looking at a stock that checks the first box for a squeeze setup: a very large short position relative to the float. The latest short interest report shows 7.82M shares sold short, which is 79.0% of the 9.91M-share float and 21.1% of shares outstanding.⁽¹⁾
That level is extreme versus the market. Across 3,578 stocks, the median short interest is 4.5% of shares outstanding, while this name sits at 21.1%, which places it around the 97th percentile.⁽¹⁾
The setup is even tighter when we look at days to cover. At 15.37 days, it is far above the market median of 4.1 days and above the 9.1-day level that marks the 90th percentile, which means shorts would need a lot of trading days to buy back their shares if they all rushed for the exit at once.⁽¹⁾
At the same time, this is not a clean momentum story yet. The stock closed at $2.75 on 2026-10-16, the last session fell 3.8%, and no clear catalyst was identified in the recent headlines.⁽²⁾
That leaves us with a classic setup squeeze, meaning the short position is crowded but the trigger has not fully fired. The stock can still move sharply if buyers force shorts to cover, but it can also drift if the market loses interest.⁽¹⁾⁽²⁾
Short Interest and Days to Cover
Short interest is the number of shares investors have borrowed and sold betting the price will fall. In this name, that figure is 7.82M shares, and the float is only 9.91M shares, so for every 100 shares that can trade freely, about 79 have been borrowed and sold.⁽¹⁾
That is not just high in absolute terms. It is high relative to the market and the peer group. The stock’s 21.1% short interest as a share of shares outstanding is above the market 95th percentile of 18.3%, and it ranks 2 of 29 in its broader industry group, with only Build-A-Bear Workshop higher on that measure.⁽¹⁾
Days to cover is the time shorts would need to buy back shares if they used normal trading volume. At 15.37 days, this stock sits well above the market median of 4.1 days and above the 90th percentile of 9.1 days, which tells us the exit door is narrow if the crowd tries to leave together.⁽¹⁾
The history also matters. Short interest has stayed elevated through the last several reports, moving from 8.19M on 2026-06-15 to 7.82M on 2026-09-30, while days to cover has swung around as volume changed. That tells us the short base has not disappeared, but it also tells us the squeeze pressure depends heavily on trading activity, not just on the number of shares short.⁽¹⁾
For traders, the key question is whether the stock starts rising on stronger volume. If it does, shorts may have to buy back shares into a thinner float, which can push the move further. If volume fades, the setup can cool off even with a large short position still in place.⁽²⁾⁽¹⁾
| Short interest (% of all shares) | Days to cover | |
|---|---|---|
| FLWS (this stock) | 21.1% | 15.37 |
| Industry median (28 peers: Retail-Retail Stores, NEC) | 3.4% | 4.5 |
| Peer: Build-A-Bear Workshop (BBW) | 23.5% | 4.5 |
| Peer: The RealReal (REAL) | 14.3% | 6.3 |
| Peer: Academy Sports and Outdoors (ASO) | 14.1% | 5.5 |
| Peer: Neighborhood Intelligence (NXH) | 13.6% | 4.8 |
| Peer: Bath & Body Works (BBWI) | 10.2% | 3.0 |
| Typical US-listed stock (median) | 4.5% | 4.1 |
| Most-shorted 10% of stocks start at | 13.7% | 9.1 |
| Most-shorted 1% of stocks start at | 26.8% |
Context for the numbers. This table measures short interest as a percent of all shares the company has issued, because that is the one measure we can compare across 3,578 stocks. The stricter percent-of-float figure used elsewhere in this article is always higher than this one. On this measure FLWS is more heavily shorted than about 97% of exchange-listed stocks.
Hover over a bar for the figures. Red bars: shares sold short at each twice-monthly report. Dashed blue line: the float, meaning the shares free to trade. Latest: 7.82M shares short, 79.0% of the float.
Borrow Fee and Availability
Borrow fee is the annual cost to borrow shares for a short sale. Here it is 1.45%, which is low versus the market median of 0.41% but far below the 11.03% level at the market 90th percentile and nowhere near the 216.43% level at the 99th percentile.⁽⁴⁾⁽¹⁾
That means the borrow itself is not especially expensive. In other words, shorts are not being crushed by financing costs right now, so the squeeze case is coming more from crowding and trading pressure than from a painful borrow bill.⁽⁴⁾
Availability is tighter, though. Only 100,000 shares were available to borrow, equal to 1.28% of shares short, which suggests the lending pool is not deep relative to the existing short position.⁽⁴⁾
We also note 46,522 failed deliveries in the latest half month, which means some trades did not settle on time. The stock is not on the regulatory threshold list for persistent delivery failures, so this is a warning sign, not a delisting-style problem.⁽⁴⁾
That mix matters. A low borrow fee can keep shorts comfortable, but limited availability can make it harder for new shorts to enter and can make covering more abrupt if the stock starts moving. If the available shares shrink further while price and volume rise, the squeeze argument gets stronger.⁽⁴⁾⁽²⁾
Price and Volume Trigger
Price is the spark that can turn a crowded short into a squeeze. The stock closed at $2.75 on 2026-10-16, is up 10.0% from its 20-day low, and sits below its 5-month high of $4.70, so it has room to move before it revisits the recent peak.⁽²⁾
The last session traded 2.95M shares, which is 9.1 times the 60-session average volume of 322,948 shares. That is the kind of volume that can matter because shorts do not cover in theory, they cover by buying actual shares in the market.⁽²⁾
We also see that the stock was down 3.8% in the last session, even after the recent bounce. That tells us the move is not yet a one-way squeeze, and it also reminds us that a crowded short can still win if buyers do not keep showing up.⁽²⁾
The market cap is $176.5M, which is small enough that a few days of heavy trading can matter more than they would in a much larger company. But the counterpoint is just as important: if the stock cannot hold gains, the same thin float can work in reverse and make declines fast too.⁽²⁾
For a trader watching this setup, the next thing to look for is follow-through. A rise on above-average volume would suggest shorts are under pressure, while a fade back toward the recent low would suggest the squeeze fuel is not being lit yet.⁽²⁾⁽¹⁾
Hover over any day for its price and volume. Blue line: daily closing price. Bars: shares traded each day; dashed line: the usual (60-day average) volume. The latest price of $2.75 is 43% below the six-month high of $4.82 (May 08). Orange bars mark days with at least three times the usual trading volume; the most recent was Oct 16.
Options and Gamma
Options are contracts that give traders the right, but not the obligation, to buy or sell shares at a set price before a set date. In this stock, options are available, and the open interest in calls, the number of outstanding bullish contracts, is 92 contracts versus 4 put contracts, the bearish side.⁽⁵⁾
Call volume was 288 contracts versus 5 put contracts, so the call side was much busier than the put side. The call-to-put volume ratio was 57.6, which shows traders were leaning bullish in the options market even though the stock itself was still choppy.⁽⁵⁾
Implied volatility, the market’s estimate of how much the stock may swing, was 89% near the money, meaning options were pricing in a large move. That can help a squeeze because expensive options often attract speculative buying, but it can also hurt buyers because high volatility makes options costly.⁽⁵⁾
Gamma squeeze is the feedback loop that can happen when call buying forces market makers to buy shares to hedge their exposure. Here, the setup is limited for now because there were no out-of-the-money call contracts 10% to 30% above spot, and the call open interest represented only 0.09% of the float in share terms.⁽⁵⁾
So options are a possible accelerant, not the main engine. If call buying expands and the stock starts rising, hedging flows could add fuel. If not, the current options position looks too small to drive the story on its own.⁽⁵⁾⁽²⁾
Almost no contracts are outstanding at these strikes, so the chart shows today’s trading volume instead of open interest. Hover over a strike for open interest, implied volatility, delta and gamma. Gamma measures how quickly an option’s sensitivity to the share price changes; the lower panel turns it into the shares option sellers would have to buy or sell to hedge a 1% price move (about 252 on the call side and 0 on the put side in total). It is an estimate from standard option-pricing maths, not a measured trading flow.
Catalysts and Filings
We did not find a clear headline catalyst in the recent news flow. That matters because a squeeze usually needs a reason for buyers to show up, whether that is earnings, a filing, a strategic update, or some other surprise.⁽²⁾⁽⁶⁾
There were 2 Form 8-K filings in the last 60 days, one tied to a material agreement and one tied to results of operations, which is the company’s way of disclosing important events between regular reports.⁽⁶⁾
We did not find any dilution filings in the last 12 months. A dilution filing is a registration statement or prospectus supplement that lets a company sell new shares, and none were reported here.⁽⁶⁾
That lowers one bear risk, but it does not remove the business risk. The company still has to prove that its operations can support the balance sheet and the stock price, and without a fresh catalyst the market may simply keep treating this as a crowded short rather than a live squeeze.⁽³⁾⁽⁶⁾
For traders, filings matter because they can change the story fast. A positive filing can force shorts to rethink the trade, while a financing or share issuance filing can do the opposite and give bears a new reason to stay in.⁽⁶⁾
Solvency and Dilution Risk: The Bear Case
The bear case starts with the balance sheet. The company has $11.4M in cash and $248.9M in total debt, which leaves $237.6M in net debt.⁽³⁾
That is a meaningful debt load for a company with a $176.5M market cap. It also means the equity is not sitting on a huge cash cushion, so the stock can stay under pressure if operations weaken or if the market starts worrying about refinancing risk.⁽³⁾⁽²⁾
The operating numbers are mixed. Trailing 12-month revenue was $1.50B, gross margin was 38.0%, operating cash flow was $18.3M, free cash flow was $25.3M, and net income was negative $134.8M.⁽³⁾
That combination tells us the business is still generating sales and cash, but it is not translating into bottom-line profit. Shorts often focus on exactly that gap: a company can have revenue and still be a poor equity story if debt is high and earnings are negative.⁽³⁾
There is also no dilution signal in the last 12 months, which is helpful for bulls, but it does not eliminate the risk that management could need capital later. If the stock weakens and the business needs cash, the market may start pricing in dilution risk even before any filing appears.⁽⁶⁾⁽³⁾
How I Would Play This
As an illustration only, not advice: I would treat this as a crowded-short setup first and a squeeze trade second. I would not assume the move is already underway just because the short interest is high. I would want to see price hold above the recent bounce and volume stay well above the 60-session average before I considered any exposure. I would keep the size small because the stock is a Penny Stock and can move fast in both directions. I would also respect the fact that short interest is reported twice a month, so the picture can change before the next report. If I wanted upside exposure, I would think about a small share position or a limited-risk call option position, but only if I had a clear trigger. If the stock loses the recent support and volume dries up, I would see that as the thesis breaking. If I were bearish, I would still be careful because a crowded short can rip higher quickly.⁽²⁾⁽¹⁾⁽⁵⁾
A share position means owning the stock outright, which can lose all of its value but no more than what you paid. A call option is a contract that can gain a lot if the stock rises, but it can also expire worthless, so the most you can lose is the premium paid. Those can fit a squeeze setup because they let a trader express upside without needing the stock to explode immediately. Staying out is always a valid choice, especially when the catalyst is not clear. Shorting a crowded stock can lose more than you put in because the price can rise without a natural ceiling, and that is exactly why squeeze names deserve respect.⁽⁵⁾⁽²⁾
What Would Invalidate the Thesis
The first thing that would weaken the squeeze case is a lack of follow-through. If the stock cannot hold its recent gains and volume falls back toward the 322,948-share average, the crowding may remain but the pressure may not.⁽²⁾
A second warning sign would be a fresh increase in supply. If borrow availability improves materially or if new shares enter the market through a filing, the squeeze setup gets less tight and shorts get more room to operate.⁽⁴⁾⁽⁶⁾
A third risk is that the business story worsens. With $237.6M in net debt and negative net income, any sign of weaker operations could shift the market back toward the bear case and away from the squeeze case.⁽³⁾
Options can also fail to help. If call volume fades and implied volatility cools from 89%, the options market may stop adding fuel, which would leave the stock more dependent on plain cash buyers.⁽⁵⁾
In short, the thesis breaks if price, volume, and trader interest do not line up. The short position is still crowded, but crowding alone is not enough.⁽¹⁾⁽²⁾
Conclusion
1-800-FLOWERS.COM is one of the most crowded shorts in the market, with short interest at 21.1% of shares outstanding and days to cover at 15.37, both far above typical levels. The borrow fee is not extreme, but available shares are limited, which keeps the setup tight.⁽⁴⁾ We do not see a clear catalyst in the recent headlines, so this is a setup squeeze rather than a live squeeze. Our overall read is cautious: the ingredients for a squeeze are there, but the stock still needs a trigger and follow-through to turn crowding into forced buying.⁽²⁾⁽¹⁾
Sources
Where the figures in this article come from, so you can check them yourself:
- FINRA equity short interest report, settlement date 2026-09-30
- Daily price and volume history for FLWS
- Financial statements and balance sheet for FLWS
- Borrow fee and shares available from Interactive Brokers’ public stock loan file; failed deliveries and threshold list from SEC and exchange data
- Listed options chain for FLWS
- SEC filings for FLWS
How We Score This (Methodology v1)
Every stock in our daily scan gets two scores from 0 to 100. Each ingredient is scaled between a level that earns no points and a level that earns full points, then weighted by how much it matters. A score is the points earned divided by the weight of the ingredients we could measure, so a stock without listed options is not penalised for it.
Setup Score: how crowded and fragile is the bet against the stock?
| Ingredient | Weight | Points earned | How it scales |
|---|---|---|---|
| Short interest as % of float | 30 | 30.0 | 5% = 0 pts, 40% = full |
| Days to cover | 10 | 10.0 | 1 day = 0, 8 days = full |
| Borrow fee (annualised) | 15 | 0.0 | 5% = 0, 100% = full (log scale) |
| Shares available to borrow vs shares short | 10 | 9.9 | 50% of short = 0, 1% = full |
| Change in short interest since the prior report | 10 | 0.5 | 0% = 0, +30% = full |
| Float size | 10 | 10.0 | 500M shares = 0, 50M = full |
| Fails-to-deliver / Reg SHO threshold list | 5 | 4.7 | On threshold list = full |
| Listing pressure (low share price) | 10 | 1.2 | $3 = 0, $1 or below = full |
Momentum Score: is the squeeze already starting?
| Ingredient | Weight | Points earned | How it scales |
|---|---|---|---|
| Volume vs 60-day average | 30 | 30.0 | 1.5x = 0, 8x = full (log scale) |
| 5-day price change | 20 | 0.0 | +5% = 0, +100% = full |
| Gain from the 20-day low | 15 | 0.0 | +15% = 0, +150% = full |
| Call open interest (in shares) vs float | 15 | 0.0 | 1% = 0, 25% = full |
| Call/put volume ratio | 5 | 5.0 | 1.0 = 0, 5.0 = full |
| Implied volatility (nearest expiry, near the money) | 5 | 0.6 | 60% = 0, 300% = full |
| Social attention (StockTwits / Reddit) | 10 | n/a | Not scored in v1 (needs a browser session) |
Squeeze Score. The geometric mean of Setup and Momentum, so a stock needs both a crowded short and price pressure to rank highly. It is reduced by 20% if the company has recently filed paperwork that lets it sell new shares into a rally (which gives short sellers an exit), and by 15% if it has less than 12 months of cash at its current burn.
Size categories. Large Caps: market value of $10B or more. Penny Stocks: share price under $5 and market value under $300M. Small Caps: everything else.
A caution on timing. Short interest is only reported twice a month, so the true position today may be higher or lower than the figure shown.
This article is for educational and informational purposes only. It is not financial advice or a recommendation to buy or sell any security. Short squeeze stocks are extremely volatile and you can lose all of your investment. We may hold positions in securities we discuss. Do your own research.
Join the LF0 Equity Research community on Discord
Get each new research article as it is published and talk it through with other readers.
Leave a Comment