PBands Lower Band Mean Reversion Long Only — Backtesting Analysis
Backtest period: 2016-01-01 to 2020-01-01 | Universe: XLP | Engine: quantstrat (R)
Strategy Overview
My hypothesis was that consumer staples can drift too far, too fast from their short-term fair value and then snap back as buyers step in. In a sector like XLP, where earnings and cash flows tend to be relatively stable and panic selling is often more mechanical than fundamental, I expected mean reversion at short-term extremes to be a useful edge: buy when price becomes unusually stretched to the downside, then exit as that dislocation fades.
To measure that stretch, I used Percentage Bands, which are a volatility-adjusted envelope built around a moving average. Think of them as a moving “comfort zone” for price: the center line is the recent average, and the lower band marks a level that says, in effect, “this is unusually cheap relative to the recent past.” I used a 20-day lookback with a simple moving average and a relatively sensitive short-term structure, so the bands respond to the last month of trading rather than to a much longer history; a shorter window would make the bands react faster but also generate more signals, while a longer window would smooth out noise and only flag larger moves.
The trading logic was straightforward. We buy XLP only when the close crosses below the lower Percentage Band, which is my trigger that the sector has become short-term oversold. We then exit either when price crosses back above the center line — the point at which the bounce has normalized enough to take profits — or if a 5% trailing stop is hit, which protects us if the decline continues instead of reversing.
What could go wrong is just as important. This setup will struggle when consumer staples enter a sustained downtrend and the “oversold” condition keeps getting cheaper, because mean reversion can fail badly when a new regime is in place. It is also vulnerable to gap-down opens and fast selloffs that move through the stop before the market can offer a realistic exit, and it implicitly assumes that short-term extremes in XLP are temporary rather than the start of a larger repricing.
Performance Results
| Metric | Value |
|---|---|
| Initial Equity | $100,000 |
| Final Equity | $100,703 |
| Net P&L | $703 |
| CAGR | 0.18% |
| Ann. Sharpe | 6.87 |
| Profit Factor | 2.76 |
| # Trades | 15 |
| Win Rate | N/A |
| Avg Trade P&L | $47 |
| Avg Win | $92 |
| Avg Loss | $-133 |
| Max Drawdown | -0.28% |
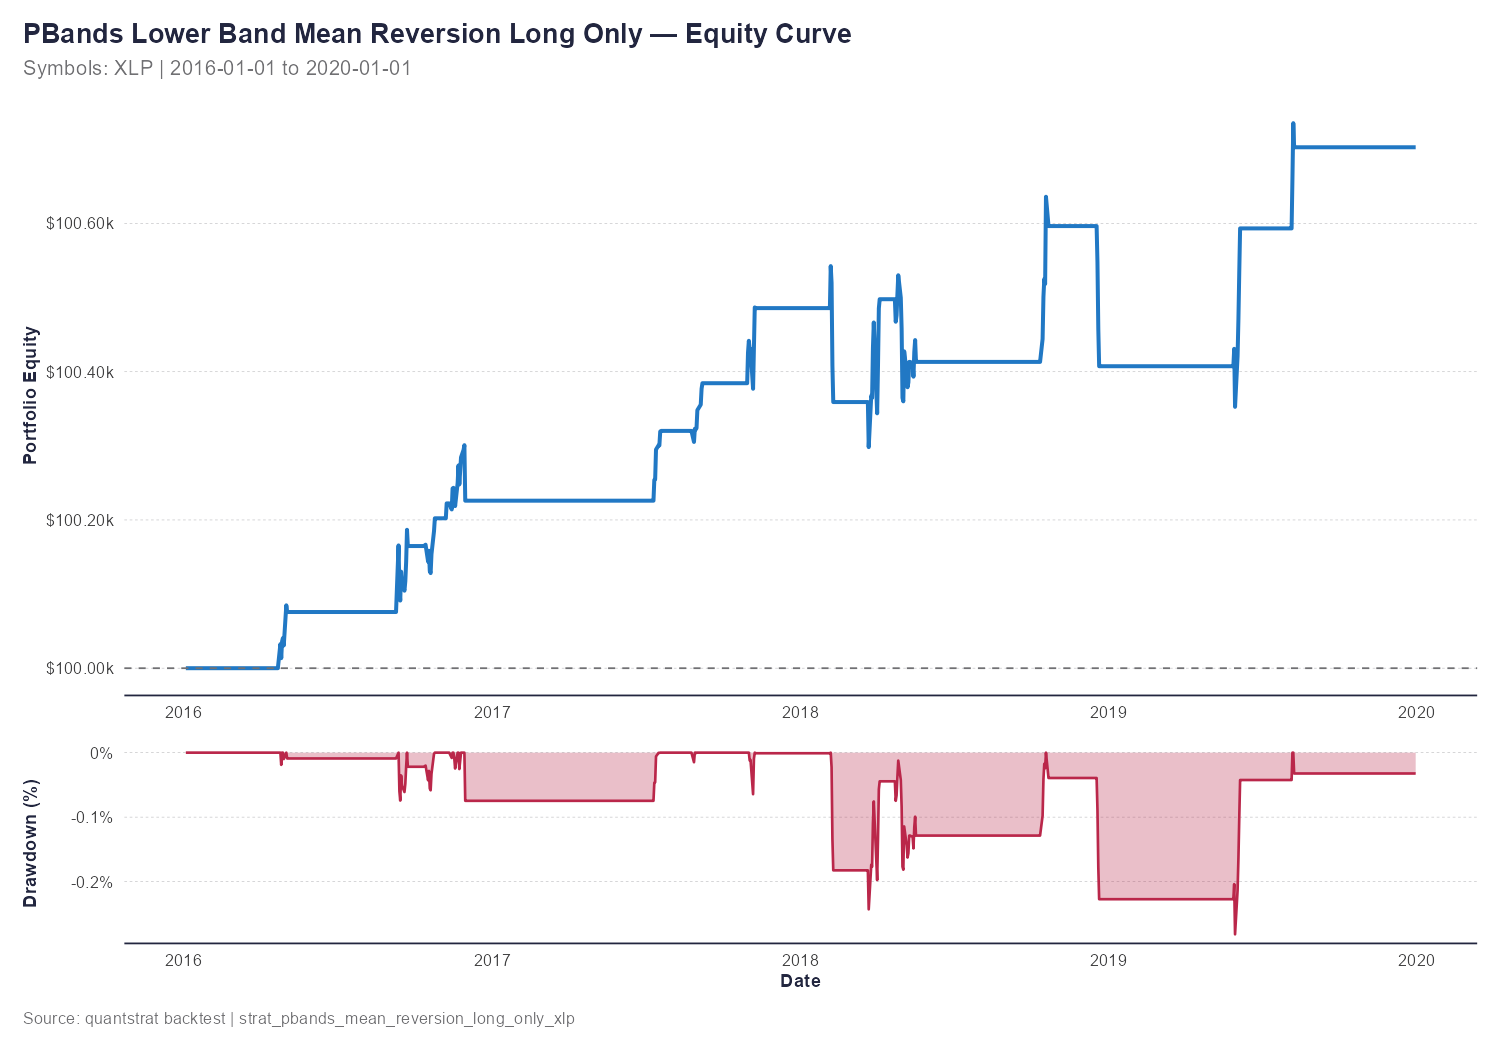
Our hypothesis was that consumer staples could drift far enough from short-term fair value to create a useful mean-reversion edge, and the backtest did support that idea — but only weakly. The strategy was profitable, finishing with a net P&L of $702.75 and turning $100,000 into $100,702.75 over the four-year test window. That corresponds to a CAGR of just 0.18%, which is plainly too small for me to call a standalone trading strategy; the real question is whether the structure of the returns still looks like the kind of short-term reversion we expected.
The Sharpe ratio measures how much return you earn per unit of risk taken — a ratio above 1.0 is generally considered good, above 2.0 is excellent. On that measure, we got 6.87, which is extremely strong, but I would be cautious about over-interpreting it because the return sample is tiny and the equity curve barely moves in dollar terms. The profit factor is gross profits divided by gross losses; ours was 2.76, which does suggest the strategy is structurally sound in the sense that winning trades outweighed losing trades by a healthy margin. So even though the absolute return is unimpressive, the loss profile did not overwhelm the edge, which is exactly what we would hope to see from a mean-reversion setup.
We only generated 15 trades, which is below the rough 30-trade threshold where I start feeling more comfortable about statistical significance. That means we are still in fragile territory, and luck could easily be playing a meaningful role here. The win rate was not reported directly in the output, but the profit factor and average trade tell the story: the strategy appears to be making money through a modest number of decent winners rather than through frequent small gains, with average winning trades of $91.93 versus average losses of $133.46.
The drawdown was very small in absolute terms, with a max drawdown of about -$283.42, or -0.28% of equity. The equity curve looks lumpy rather than smooth, with long flat stretches punctuated by a few step-like gains, which is what I would expect from a low-frequency mean-reversion strategy in a defensive ETF like XLP. That shape is encouraging from a risk-control standpoint, but it also reinforces the main limitation here: this is more of a mild edge than a compelling return engine, and it would need either more trade frequency or stronger signal quality before I would trust it on its own.
Risk Assessment
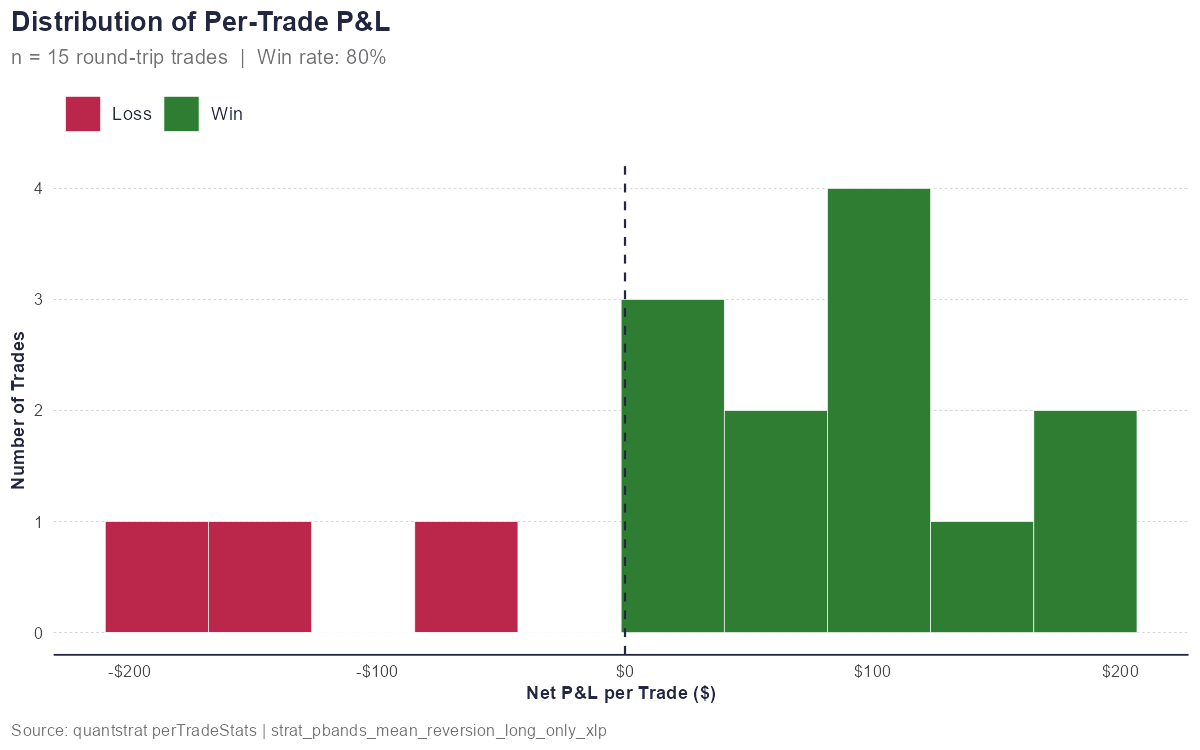
The per-trade distribution is mildly right-skewed in the sense that most trades are profitable, but the losses are noticeably larger than the average win, which is exactly the kind of asymmetry I worry about in a mean-reversion system. We had an average win of $91.93, an average loss of -$133.46, and the largest single loss was -$189.08. That is not the ideal shape for a “buy the dip and fade the panic” strategy, because I want to see many small-to-medium wins and only a few controlled losses; here, the losses are not catastrophic, but they are bigger than the typical winner, so the payout profile is only partially consistent with the hypothesis.
Drawdown measures how far the portfolio has fallen from its previous high-water mark — a 10% drawdown means we are currently 10% below our best-ever equity level. In this backtest, the worst drawdown was only about -$283.42, or -0.28% of equity, and it did not develop into a prolonged equity setback. That is a very shallow pain profile, but it also means the strategy simply never had to survive a real stress event; against a four-year window, the return of 0.18% annualized is so small that even a tiny drawdown looks large relative to the reward. In plain terms, the capital at risk was modest, but the payoff was also modest enough that I cannot call the risk/reward compelling.
The failure modes worry me more than the average numbers do. The first is a sustained sector downtrend, where every “oversold” reading becomes a new lower low and the market keeps repricing staples cheaper instead of snapping back; structurally, a mean-reversion model is vulnerable here because it is trying to catch a falling knife before the regime has actually changed. The second is a gap-down event, such as an earnings shock or macro selloff, which can blow through the trailing stop before we get a realistic exit and turn a small planned loss into a much worse one. The third is prolonged sideways chop, where signals keep firing but price never cleanly recovers to the center line, so we churn through trades and let friction eat the edge.
If I were tightening this up, I would add a simple trend filter so we do not buy dips when XLP is already in a persistent downtrend, because that is where the model is most structurally fragile. I would also reduce the 5% trailing stop or replace it with a volatility-based stop so losses are capped more consistently in fast markets. Finally, I would limit the number of entries in a short window, because in choppy conditions the strategy can overtrade the same noise and I do not want to keep paying to be early.
Conclusion & Educational Insights
Our Verdict
We set out to test whether consumer staples mean reversion could generate consistent returns in XLP. Here is what we found. The hypothesis was partially confirmed: the signal did capture some real short-term reversion, but the edge was too small and too infrequent to qualify as a robust standalone strategy.
The backtest was profitable, but only barely in absolute terms: $100,000 grew to $100,702.75 over four years, which is a CAGR of just 0.18%. That is not enough return for me to get excited on its own. At the same time, the structure of the results was not broken — the profit factor was 2.76, the max drawdown was only -0.28%, and the equity curve never suffered a serious collapse. So my takeaway is not “this idea failed,” but rather it has the right shape, just not enough scale. The strategy looks structurally plausible, yet too weak and too sparse to trust without more work.
My personal opinion is that this is worth developing further, but only as a research candidate, not as a trade-ready system. I would not deploy it as-is, but I do think it contains a genuine signal worth refining.
What This Taught Me
- The strategy only produced 15 trades in four years, which is far too few for me to separate skill from luck with confidence.
- The 0.18% CAGR told me immediately that a good-looking risk profile does not matter if the return itself is too small to be useful.
- The profit factor of 2.76 was the most encouraging result in the whole test — it suggests the edge is real, even if it is weak.
- I was struck by the mismatch between the average win of $91.93 and the average loss of -$133.46. That is not the ideal payout shape for a dip-buying mean-reversion system.
- The max drawdown of -0.28% showed that the strategy controlled downside well, but it also reminded me that this backtest never faced a truly stressful environment.
- The equity curve’s lumpy, step-like behavior told me the signal is not harvesting frequent small edges; it is waiting for a few favorable reversions and doing very little in between.
- I learned that in a defensive ETF like XLP, mean reversion can be real but still too weak to matter economically unless the signal is sharpened or the trade frequency improves.
If I Were to Continue This Research
My first step would be to test whether the result is sensitive to the band settings. I would vary the 20-day lookback to something shorter and longer, and I would also test different band-width multipliers to see whether the current trigger is too strict or too loose. If the signal is real, I want to know whether it improves with faster responsiveness or whether it needs a wider definition of “oversold” to avoid noisy entries.
Next, I would add a simple regime filter. The biggest structural risk here is buying dips in an already weakening trend, so I would test conditions like only trading when the 200-day moving average is rising or when XLP is above its long-term trend. I would also test the strategy on other defensive or low-volatility equity ETFs, and possibly on sector proxies with similar behavior, to see whether this is an XLP-specific quirk or a broader consumer-staples effect. If it only works in one instrument, I would be much less confident that the edge is durable.
I would consider this paper-trade worthy only if I could improve both trade frequency and payout structure while keeping drawdown shallow. That means more than 15 trades over a multi-year sample, a cleaner average win/loss relationship, and results that still hold after realistic transaction costs and slippage. A strategy with a tiny gross edge can disappear quickly once we account for execution friction, so I would want to re-run the test with conservative cost assumptions before trusting any improvement.
Backtests are the beginning of a research process, not the end — but they are an essential tool for stress-testing whether an idea survives contact with historical data.
Important: Backtests are simulations. Past performance of a simulated strategy does not guarantee future results. Results do not account for real-world factors including bid-ask spread, market impact, borrow costs, or taxes. This is for educational purposes only and is not investment advice.
Leave a Reply