
| Company | Jul 25 | Aug 25 | Sep 25 | Oct 25 | Nov 25 | Dec 25 | Jan 26 | Feb 26 | Mar 26 | Apr 26 | May 26 | Jun 26 | 12-Mo |
|---|---|---|---|---|---|---|---|---|---|---|---|---|---|
| OMC | +0% | +9% | +5% | -8% | -5% | +14% | -5% | +11% | -11% | +2% | -5% | +1% | +5% |
| TTD | +21% | -37% | -10% | +3% | -21% | -4% | -20% | -21% | -5% | +4% | -9% | -16% | -75% |
| WPP | -23% | -2% | -6% | -23% | +6% | +12% | -7% | -11% | -16% | +16% | +3% | -14% | -54% |
| PUBGY | -17% | +1% | +5% | +4% | -3% | +6% | -3% | -11% | -7% | +13% | +5% | +2% | -8% |
| CHTR | -34% | -1% | +4% | -15% | -14% | +4% | -1% | +14% | -8% | -23% | -13% | -1% | -65% |
Source: Yahoo Finance monthly adjusted close.
Executive Summary
Rating: HOLD | OMC
Measured from adjusted close on 2026-07-15 to 2026-10-14. Sell ratings are correct when the stock falls; Hold is tracked as a +/-10% range. Daily-close data, not intraday. Calls are tracked for 182 days from publication, then frozen as a final record.
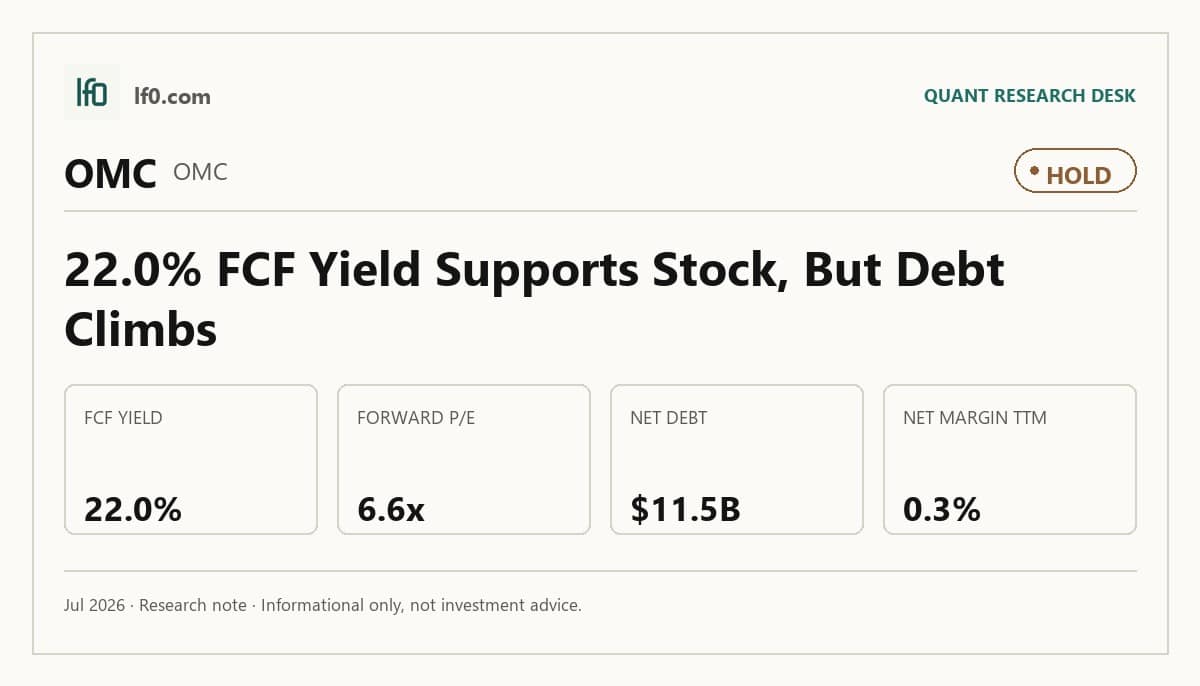
I would put my rating as a Hold because Omnicom’s merger-driven scale is real, but the integration still has to prove it can turn that scale into cleaner earnings. Revenue reached $6.2B in Q1 2026, up 69.2% year over year, yet TTM net margin is only 0.3% and the balance sheet still carries $11.5B of debt, so I do not think the market is underestimating execution risk. The strongest support for the shares is the 22.0% TTM FCF yield, which tells me the company is already generating enough cash to fund capital returns and absorb some integration cost. I would move more toward a Buy if Omnicom can hold revenue growth near the 4% constant-currency pace flagged at Investor Day and convert that into a positive net margin for several quarters, because that would show the synergy plan is reaching the income statement rather than staying on paper.
Company Profile
Omnicom Group Inc. provides marketing, communications, and commerce services through global networks in media, content, branding, public relations, healthcare, experiential, and execution support. It earns revenue from agency fees and project work across the Americas, EMEA, and Asia Pacific, and its Omni platform ties data, identity, and AI tools into client workflows. The company completed its merger with Interpublic Group of Companies on November 26, 2025, and legacy Omnicom shareholders owned 60.6% of the combined company on a fully diluted basis. Omnicom is listed on the NYSE under OMC and employs about 120,000 people worldwide.
Economic Moat
Business Model
Omnicom’s client matrix organization, backed by Omni, is the most defensible part of the model because it links data, creativity, and execution across multiple agencies in a way I feel is hard to replicate quickly. Omni now includes Acxiom and Interact, both acquired from IPG, plus privacy-focused identity and data management capabilities, and the January 2026 version adds generative AI into planning, creative advertising, media, and analytics workflows. That is more than a software layer; it is embedded across client teams through the Global Growth Team and Client Success Leaders, which makes the platform stickier than a standalone agency relationship. The company’s 100 largest clients represented about 54% of revenue in 2025, and the largest client represented 24%, so scale and cross-selling matter, but they also leave concentration risk in the model.
The IPG merger broadened the service stack and deepened the platform, which is consistent with the moat thesis above. In my view, the combined network is stronger than it was five years ago because the acquired assets make Omni more useful, but the business now depends more on integration discipline and client retention than it did before the merger.
Business & Operating Risks
The most material disclosed risk is client spending contraction, because a reduction in client budgets can cut demand for marketing and communications services, delay payments, and force Omnicom to fund working capital on less favorable terms. The filing also warns that media and production commitments can substantially exceed the revenue from services, so a client default can create a cash loss even when revenue is still booked. Client concentration is the next issue: the largest client was about 2.4% of 2025 revenue and the 100 largest clients were about 54.0%, which means a few account reviews can move the top line faster than the company can replace them. Cybersecurity and data privacy are also more important now because remote work, third-party cloud providers, and AI tools widen exposure, while GDPR and CCPA make digital services more costly to deliver.
The IPG merger adds execution risk through retention, integration costs, and synergy capture, but I do not think those risks directly threaten the Omni moat so much as test whether it can be scaled without losing client trust. The real question is whether the platform stays sticky while the company absorbs a much larger operating footprint.
Management Discussion & Analysis
Management is clearly responding to the integration and leverage risks by pairing the IPG merger with a large buyback program and a refinancing step. Omnicom completed the merger, exchanged about 94% of IPG senior notes for $2.76B of new Omnicom notes, and authorized a $5B share repurchase program with an accelerated repurchase of about $2.5B. That tells me management is leaning into cash return, not balance-sheet repair, which is credible only if the synergy plan keeps moving. The next-generation Omni launch in January 2026 supports the strategic story, but the 2025 cost reset was severe enough that operating margin fell to 2.6% from 14.5% after $1.2B of severance, real estate repositioning, contract cancellations, and other efficiency costs plus $547.1M of disposition losses.
The track record is mixed. Revenue rose 10.1% in 2025, so the Flywheel Digital acquisition call was directionally right, but operating income fell sharply and diluted EPS turned negative, which tells me the top line benefit was overwhelmed by transaction and restructuring costs. Leadership continuity has been stable, so there is no governance disruption to explain the swing. I read management as confident, but the burden of proof is still on execution.
Recent Events
The February 18, 2026 board approval of a 5B share repurchase program, paired with 2.5B of accelerated repurchases, is the clearest capital-allocation signal in the recent filings. It strengthens the equity case because management is committing post-merger cash flow to per-share accretion rather than leaving it idle.
The March 2, 2026 debt issuance is the other important event. Omnicom closed $1.7B of new senior notes, including $400M due 2029, $700M due 2033, and $600M due 2036, and used the proceeds to refinance the $1.4B of 3.6% notes due April 2026. In my view, that lowers near-term refinancing risk and gives the combined company more flexibility while it integrates IPG.
Investor Day on March 12, 2026 and the May 5, 2026 annual meeting reinforce execution rather than change the story. Management laid out roughly 4% 2026 constant-currency revenue growth, $1.5B of cost synergies over 30 months, and about 2.4x debt to adjusted EBITDA by year-end 2026, while shareholders later re-elected the board and approved pay and auditors. Taken together, the recent events support the moat thesis by showing capital discipline and integration progress, not deterioration.
Financial Analysis
Growth
OMC — Financial Growth (Quarterly, USD Mil)
| Metric | 2025-03-31 | 2025-06-30 | 2025-09-30 | 2025-12-31 | 2026-03-31 |
|---|---|---|---|---|---|
| REVENUE (USD Mil) | 3,690.4 | 4,015.6 | 4,037.1 | 5,528.8 | 6,242.9 |
| EBIT (USD Mil) | 482.3 | 461.1 | 547.3 | -949.2 | 693.2 |
| EBITDA (USD Mil) | 541.3 | 519.8 | 608 | -850.9 | 860.1 |
| NET INCOME (USD Mil) | 287.7 | 257.6 | 341.3 | -941.1 | 405.2 |
| DILUTED EPS | 1.4 | 1.3 | 1.8 | -4 | 1.4 |
Source: Yahoo Finance — Quarterly Financial Statements
Revenue stepped up from $3.7B in Q1 2025 to $6.2B in Q1 2026, a 69.2% increase that is mostly merger driven because IPG was included only from the closing date. The path was not smooth: revenue was $4B in Q2 2025 and $4B in Q3 2025 before jumping to $5.5B in Q4 2025 and then $6.2B in Q1 2026, so the latest quarter looks like acquisition timing rather than a clean organic acceleration. EBITDA rose to $860.1M in Q1 2026 from $541.3M a year earlier, while diluted EPS was 1.35 versus 1.45, which tells me the scale benefit is real but the earnings bridge is still distorted by merger accounting and integration costs. That matters for the moat because the platform can clearly absorb more revenue, but investors still need proof that the larger base will convert into cleaner earnings.
Profitability
OMC — Profitability (TTM)
| Metric | TTM |
|---|---|
| Operating Margin (TTM) | 11.9% |
| Net Margin (TTM) | 0.3% |
| Return on Assets (TTM) | 4.5% |
| Return on Equity (TTM) | 2.0% |
| Gross Margin (TTM) | 18.4% |
| EBITDA Margin (TTM) | 15.9% |
Source: Yahoo Finance — Trailing Twelve Months (TTM)
TTM operating margin was 11.9%, gross margin was 18.4%, and EBITDA margin was 15.9%. The 6.5-point gap between gross and operating margin shows Omnicom still carries a meaningful opex load, but the business is already past the early scaling phase because it is converting a solid share of gross profit into operating profit. TTM net margin was 0.3%, so most of the operating profit is being absorbed below the line, which tells me to watch financing and integration costs more closely than top-line economics.
TTM return on assets was 4.5% and TTM return on equity was 2.0%. The 2.5-point ROE-to-ROA gap suggests returns are being amplified by leverage rather than just by asset productivity, so the quality of equity returns will matter more if credit conditions tighten. The key next signal is net margin moving decisively into positive territory, because that would show the merger and cost base are translating into durable earnings rather than just EBITDA. Profitability is neutral to mildly bullish: margins are positive, but the thin net margin keeps the quality of earnings under review.
Valuation
OMC — Valuation Multiples
| Metric | Value |
|---|---|
| Market Cap (USD Mil) | 23,014 |
| Enterprise Value (USD Mil) | 31,221 |
| Trailing P/E | — |
| Forward P/E | 6.6 |
| Price/Sales (TTM) | 1.2 |
| Price/Book (mrq) | 2.4 |
| EV/Revenue | 1.6 |
| EV/EBITDA | 9.9 |
| Beta (5Y Monthly) | 0.66 |
| FCF Yield % (TTM) | 22.0% |
| Forward EPS (USD) | 12.3 |
| Analyst Target Price – Low (USD) | 79 |
| Analyst Target Price – Mean (USD) | 102.8 |
| Analyst Target Price – High (USD) | 146 |
| # Analyst Opinions | 12 |
Source: Yahoo Finance
Omnicom’s primary anchor is EV/Revenue at 1.6x, with Price/Sales at 1.2x and EV/EBITDA at 9.9x. That mix says the market is valuing the combined Omnicom and IPG platform at a modest revenue multiple, which implies investors are paying for steady cash conversion and integration benefits rather than a high-growth reacceleration. Forward P/E is 6.6x, while trailing P/E is not usable because the latest twelve months were distorted by the merger and the Q4 loss. FCF Yield is 22.0%, which is the strongest support for the stock because it shows the equity is already being priced against substantial free cash flow rather than accounting earnings alone.
On my read, fair value sits in a range of about $77–$161 per share. That range is built from the peer EV/Revenue spread and then adjusted for Omnicom’s stronger cash generation and still-elevated leverage. It sits around the analyst consensus mean of $102.8 and inside the broader $79–$146 analyst range, so I do not see a major disagreement with Street expectations; if anything, the cash yield and lower beta argue that the stock deserves to trade closer to the middle of that band than the top. Forward EPS of 12.3 also matters: at 6.6x forward earnings, the market is not paying much for growth, but it is paying for a large earnings base that still has to prove the merger can hold margins.
Leverage
OMC — Leverage & Coverage (Quarterly)
| Metric | Value |
|---|---|
| Total Debt/Equity % (mrq) | 110.6 |
| Current Ratio (mrq) | 0.9 |
| Total Debt (mrq, USD Mil) | 11,516.6 |
| Operating Cash Flow (TTM, USD Mil) | 3,171.8 |
| Levered Free Cash Flow (TTM, USD Mil) | 5,066.6 |
| Net Debt/EBITDA (TTM) | 2.3 |
| FCF Margin % (TTM) | 25.6% |
Source: Yahoo Finance — Quarterly Financial Statements
Omnicom’s leverage is manageable, but the merger with IPG has made the balance sheet materially larger. Total debt was $11.5B mrq, total debt to equity was 110.6%, and the current ratio was 0.9x, so liquidity is constrained rather than comfortable. Operating cash flow was $3.2B TTM and levered free cash flow was $5.1B TTM, which means EBITDA is converting into cash well and gives the company room to service debt and absorb integration costs. Net debt to EBITDA was 2.3x TTM and FCF margin was 25.6% TTM, both of which point to a solid cash buffer rather than a stressed capital structure.
The main watchpoint is the enlarged debt stack after the IPG exchange, because it will need to be refinanced over time. Even so, the current cash generation makes that a later issue, not an immediate one. Leverage is a neutral signal: the company has enough cash flow to stay flexible, but the post-merger debt load leaves less room for error.
Insider Activity
The insider transaction record here is one-sided: Linda Johnson Rice sold 1,348 shares on March 2, 2026 at $85.25, and I do not see an open-market purchase in the period shown. That is a narrow data point, so I would not overread it, but the direction is still selling only. On balance, I treat that as a mild bear signal rather than a thesis driver.
Comparable Analysis
Growth
| Company | Revenue TTM (USD Mil) | Revenue Growth YoY % | EBITDA TTM (USD Mil) | Diluted EPS TTM |
|---|---|---|---|---|
| OMC | 19,824.4 | 69.2% | 3,156.3 | -0.4 |
| TTD | 2,969.1 | 11.8% | 709.8 | 0.8 |
| WPP | 13,550 | -8.3% | 558 | -1.3 |
| PUBGY | 17,399 | 6.4% | 2,882 | 1.9 |
| CHTR | 54,636 | -1.0% | 21,975 | 37 |
Source: Yahoo Finance
Omnicom’s revenue growth is the cleanest reason it deserves a premium to WPP and CHTR but not to TTD. OMC’s revenue grew 69.2% TTM on $19.8B of revenue, versus 11.8% for TTD, 6.4% for PUBGY, and declines of 8.3% for WPP and 1.0% for CHTR. That gap says OMC is still the fastest grower in the set, but the market should not pay a TTD-style multiple for it because OMC’s diluted EPS was still -0.4 TTM while TTD earned 0.8 and PUBGY earned 1.9, so the growth is not yet translating into cleaner earnings.
Valuation
| Company | Trailing P/E | Forward P/E | EV/Revenue | EV/EBITDA | Price/Sales (TTM) | Price/Book (mrq) | Market Cap (USD Mil) | Enterprise Value (USD Mil) | Beta (5Y Monthly) | FCF Yield % (TTM) | Forward EPS | Analyst Target Price – Low | Analyst Target Price – Mean | Analyst Target Price – High | # Analyst Opinions |
|---|---|---|---|---|---|---|---|---|---|---|---|---|---|---|---|
| OMC | — | 6.6 | 1.6 | 9.9 | 1.2 | 2.4 | 23,014 | 31,221 | 0.66 | 22.0% | 12.3 | 79 | 102.8 | 146 | 12 |
| TTD | 22.5 | 8.8 | 2.7 | 11.2 | 3 | 3.6 | 8,904 | 7,922 | 1.04 | 6.4% | 2.1 | 11 | 24.3 | 38 | 30 |
| WPP | — | 5.5 | 1.8 | 43 | 0.3 | 5.8 | 3,928 | 24,010 | 0.68 | -1.6% | 3.3 | 16.5 | 18.5 | 20.8 | 3 |
| PUBGY | 13.4 | 10.1 | 1.5 | 9.2 | 1.4 | 2.1 | 24,808 | 26,553 | 0.59 | 7.3% | 2.5 | 32 | 34.2 | 36.4 | 2 |
| CHTR | 3.5 | 2.9 | 2.1 | 5.3 | 0.4 | 1 | 20,041 | 116,721 | 0.70 | 12.0% | 44.1 | 120 | 214.4 | 413 | 17 |
Source: Yahoo Finance
Valuation looks mixed, and FCF Yield is the best anchor because OMC is already producing cash. OMC’s 22.0% FCF yield beats TTD’s 6.4%, PUBGY’s 7.3%, CHTR’s 12.0%, and WPP’s -1.6%, which implies the stock is cheaper on cash generation than the headline EV/EBITDA of 9.9x suggests. Against peers, OMC also trades at 1.6x EV/Revenue and 1.2x P/S, below TTD at 2.7x and 3.0x, above PUBGY at 1.5x and 1.4x, and far above WPP at 1.8x and 0.3x. That spread is easier to justify once you pair it with leverage: OMC’s 2.3x net debt to EBITDA is far cleaner than CHTR’s 4.4x and WPP’s 7.4x, so the market is paying for a better balance sheet as well as a larger earnings base.
Profitability
| Company | Operating Margin (TTM) | Net Margin (TTM) | Return on Assets (TTM) | Return on Equity (TTM) | Gross Margin (TTM) | EBITDA Margin (TTM) |
|---|---|---|---|---|---|---|
| OMC | 11.9% | 0.3% | 4.5% | 2.0% | 18.4% | 15.9% |
| TTD | 9.7% | 14.6% | 6.6% | 16.7% | 77.8% | 23.9% |
| WPP | 2.2% | -1.6% | 0.9% | -5.3% | 15.8% | 4.1% |
| PUBGY | 15.6% | 9.5% | 4.0% | 15.5% | 45.8% | 16.6% |
| CHTR | 23.9% | 9.0% | 5.4% | 27.5% | 55.4% | 40.2% |
Source: Yahoo Finance
Profitability is where OMC sits in the middle of the pack. Its 11.9% operating margin and 15.9% EBITDA margin trail TTD’s 9.7% and 23.9% only on EBITDA, while OMC’s 18.4% gross margin is far below TTD’s 77.8%, PUBGY’s 45.8%, and CHTR’s 55.4%, which points to a cost-of-revenue disadvantage rather than an opex problem. Net margin is only 0.3%, versus 14.6% for TTD, 9.5% for PUBGY, and 9.0% for CHTR, so OMC’s scale is not yet converting into peer-level bottom-line efficiency. Returns are also modest: ROE is 2.0% and ROA is 4.5%, which is well below the stronger peers and tells me the merger still has to prove it can lift equity productivity.
Leverage
| Company | Total Debt/Equity % (mrq) | Current Ratio (mrq) | Total Debt (mrq, USD Mil) | Operating Cash Flow TTM (USD Mil) | Free Cash Flow TTM (USD Mil) | Net Debt/EBITDA (TTM) | FCF Margin % (TTM) |
|---|---|---|---|---|---|---|---|
| OMC | 110.6 | 0.9 | 11,516.6 | 3,171.8 | 5,066.6 | 2.3 | 25.6% |
| TTD | 17.3 | 1.7 | 423.6 | 1,093.1 | 569.1 | -1.4 | 19.2% |
| WPP | 246.5 | 0.9 | 6,832 | 724 | -63.2 | 7.4 | -0.5% |
| PUBGY | 54.6 | 1 | 5,695 | 2,943 | 1,816.2 | 0.5 | 10.4% |
| CHTR | 459.5 | 0.4 | 96,822 | 16,145 | 2,403.6 | 4.4 | 4.4% |
Source: Yahoo Finance
Leverage is acceptable, not clean. OMC’s 110.6% debt to equity and 2.3x net debt to EBITDA are heavier than TTD’s 17.3% and negative 1.4x, PUBGY’s 54.6% and 0.5x, and CHTR’s 459.5% and 4.4x, while WPP’s 246.5% and 7.4x are clearly worse. The 25.6% FCF margin is the key offset because it shows OMC can service its debt from cash flow even with a 0.9x current ratio, so leverage is a financing choice rather than a distress signal. Relative to the peer set, that combination of cash generation and moderate leverage is why I think the stock deserves to trade above the weakest balance sheets, but not at a premium that assumes flawless integration.
Conclusion
The key tension is whether Omnicom’s merger-driven scale is already showing up in the numbers or whether the market is still paying for a synergy plan that has not fully landed. My view is that the cash generation is real, but the earnings quality is not yet good enough to call the stock cheap in a decisive way. The 22.0% FCF yield and 6.6x forward P/E support the shares, yet the 0.3% TTM net margin and 2.3x net debt to EBITDA tell me the company still has to earn a higher rating through execution.
I would raise my rating more toward a Buy if Omnicom can hold revenue growth near the 4% constant-currency pace flagged at Investor Day and turn that into a positive net margin for several quarters, because that would show the $1.5B synergy plan is flowing through the income statement rather than staying on paper. If EBITDA margin moved from 15.9% TTM to roughly 18% on the current $19.8B revenue base, that would add about 420M of annual EBITDA, which would materially improve debt capacity and make the current valuation look too conservative.
I would move from Hold to Sell if the integration starts to leak clients and the 100 largest accounts fall materially below the current 54.0% revenue share without replacement, because that would tell me the platform is losing the very cross-sell base that justifies the merger. A second warning sign would be FCF yield slipping well below 22.0% TTM, since that would mean the market is no longer being paid enough cash to wait through the integration.
Weighing both sides, I still lean to Hold because the cash generation is already real, but the cleaner earnings proof is not. The bull case needs another few quarters of synergy capture to show up in margins, while the bear case only needs client churn or integration slippage to surface first, so I am not willing to pay up for certainty that has not arrived yet.
What’s your take? I rated Omnicom (OMC) HOLD above — but the goal here is to get this right, not just to publish an opinion. What would you add to this analysis, or which risk or catalyst do you think I’m under- or over-weighting? Tell me in the comments.
Sources
- SEC 10-K Annual Report — filed 2026-02-20
- SEC 8-K Filing (2026-05-08)
- SEC 8-K Filing (2026-04-28)
- SEC 8-K Filing (2026-03-12)
- SEC 8-K Filing (2026-03-02)
- SEC 8-K Filing (2026-02-18)
- SEC 8-K Filing (2026-01-29)
- SEC Form 4 Insider Transaction (2026-05-27)
- SEC Form 4 Insider Transaction (2026-05-27)
- SEC Form 4 Insider Transaction (2026-05-27)
- SEC 10-K Annual Report — FY2026
- SEC 10-K Annual Report — FY2025
- SEC 10-K Annual Report — FY2024
- SEC 10-K Annual Report — FY2023
- SEC 10-K Annual Report — FY2022
Data sourced from Yahoo Finance and SEC EDGAR. Not investment advice.
Leave a Comment