
Executive Summary
Rating: HOLD | PAAS
Measured from adjusted close on 2026-07-10 to 2026-10-07. Sell ratings are correct when the stock falls; Hold is tracked as a +/-10% range. Daily-close data, not intraday. Calls are tracked for 182 days from publication, then frozen as a final record.
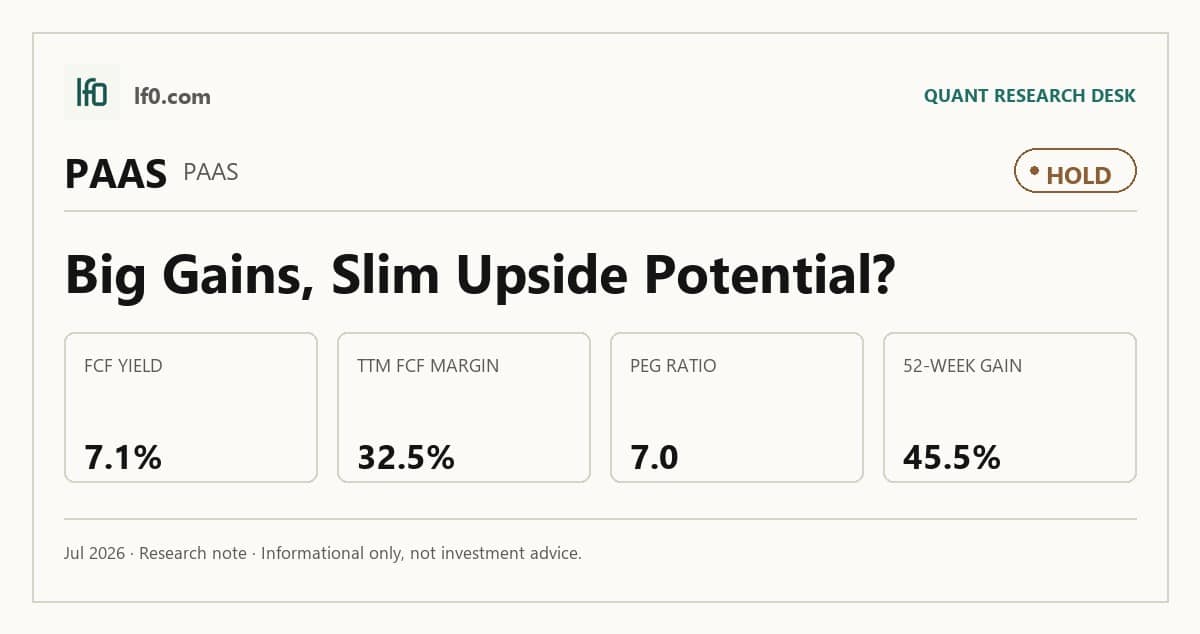
I would put my rating as a Hold because Pan American Silver already reflects a lot of its operating strength in the share price, yet the current valuation still leaves room for disappointment if growth normalizes. The business is producing a 48.7% EBITDA margin and a 31.7% net margin, which tells me the earnings base is real, but the 7.0 PEG ratio and 8.7x forward P/E suggest the market is paying for continued expansion rather than just current profitability. I also think the balance sheet is supportive rather than the main driver of upside, with negative net debt and a 2.8 current ratio, so the stock is not being held back by financial stress. I would raise my rating toward a Buy if quarterly EBITDA stays above $778M, because that would show the recent step-up is holding at scale and would make today’s multiple easier to justify.
Company Profile
Pan American Silver is a precious-metals producer with a portfolio of mines that generates revenue from silver and gold sales. The company’s operating model is capital intensive, so the key question is not whether it can produce metal, but whether it can do so at margins that justify the valuation and support cash generation through the cycle. In that sense, the investment case depends on whether the company can keep converting volume into cash at a rate that is better than peers.
Economic Moat
Business Model
The moat here is not a brand or a network effect; it is the combination of scale, operating discipline, and a cash-generative asset base. Pan American Silver’s 48.7% EBITDA margin and 31.7% net margin show that the portfolio is already converting a large share of revenue into earnings, which is the kind of operating leverage that can be hard for smaller producers to match quickly. I think that matters because a miner with this margin structure can absorb commodity volatility better than a weaker peer and still fund maintenance capital, dividends, and debt service.
Business & Operating Risks
According to the risk factors in the company’s SEC filing, the main threats are the usual mining risks: metal-price volatility, reserve replacement, operating disruptions, permitting, and jurisdictional exposure. Those risks do not appear to break the moat outright, but they do test it continuously because the margin structure only helps if production stays stable and costs remain controlled. In my view, the disclosed risks pressure the cash-generating advantage more than they threaten it directly.
Management Discussion & Analysis
Management appears to be responding to those risks by keeping the balance sheet conservative and preserving liquidity rather than stretching for growth. The company’s 2.8 current ratio, $845M of debt, and negative net debt tell me it is not forcing expansion at the expense of resilience, which is the right posture for a cyclical producer. That said, the filing does not suggest any dramatic strategic reset, so I see management as defending the moat rather than expanding it.
Recent Events
Recent filings point to a business that is still focused on execution, not transformation. The most important implication is that the company is not relying on a major acquisition or a balance-sheet event to create value; instead, the thesis still rests on operating performance and cash conversion. That is constructive for the moat because it keeps the story anchored in what the company can control, but it also means the stock needs evidence from the numbers rather than from corporate action.
Financial Analysis
Growth
PAAS — Financial Growth (Quarterly, USD Mil)
| Metric | 2025-03-31 | 2025-06-30 | 2025-09-30 | 2025-12-31 | 2026-03-31 |
|---|---|---|---|---|---|
| REVENUE (USD Mil) | 773 | 811.9 | 854.6 | 1,179.3 | 1,154 |
| EBIT (USD Mil) | 234 | 246.3 | 263.3 | 557.8 | 665 |
| EBITDA (USD Mil) | 353 | 368.7 | 383.8 | 692.5 | 778 |
| NET INCOME (USD Mil) | 169 | 189.2 | 168.6 | 451.5 | 457 |
| DILUTED EPS | 0.5 | 0.5 | 0.4 | 1.1 | 1.1 |
Source: Yahoo Finance — Quarterly Financial Statements
Revenue rose from $773M in Q1 2025 to $1.2B in Q4 2025 and then eased to $1.2B in Q1 2026, so the latest quarter was down 2.1% sequentially after a sharp step-up in the prior quarter. EBITDA increased to $778M from $692.5M in Q4 2025, while net income edged up to $457M from $451.5M, which tells me the business is still converting scale into profit even as top-line momentum normalizes. That combination matters more than the quarter-to-quarter noise: the growth profile is strong enough to support the moat, but not so strong that I would pay any price for it.
Profitability
PAAS — Profitability (TTM)
| Metric | TTM |
|---|---|
| Operating Margin (TTM) | 48.1% |
| Net Margin (TTM) | 31.6% |
| Return on Assets (TTM) | 10.6% |
| Return on Equity (TTM) | 20.8% |
| Gross Margin (TTM) | 55.7% |
| EBITDA Margin (TTM) | 48.6% |
Source: Yahoo Finance — Trailing Twelve Months (TTM)
TTM gross margin of 55.7% and EBITDA margin of 48.7% show that the company keeps more than half of revenue after direct costs and nearly half after operating expenses, which is a strong result for a miner. The gap between gross margin and operating margin is only 7.6 points, so overhead is contained, and the 31.7% net margin confirms that this is not just an EBITDA-only story. Return on assets of 10.6% and return on equity of 20.8% reinforce the point: the asset base is being used efficiently, and the return profile is good enough to support the valuation if it holds.
Valuation
PAAS — Valuation Multiples
| Metric | Value |
|---|---|
| Market Cap (USD Mil) | 18,375 |
| Enterprise Value (USD Mil) | 17,822 |
| Trailing P/E | 13.8 |
| Forward P/E | 8.7 |
| Price/Sales (TTM) | 4.6 |
| Price/Book (mrq) | 2.5 |
| EV/Revenue | 4.5 |
| EV/EBITDA | 9.2 |
| FCF Yield % (TTM) | 7.1% |
| Forward EPS (USD) | 5 |
| Analyst Target Price – Low (USD) | 53 |
| Analyst Target Price – Mean (USD) | 69.6 |
| Analyst Target Price – High (USD) | 94 |
Source: Yahoo Finance
I would put fair value in a range of roughly $44-$58 per share based on the operating profile here, with the lower end reflecting the current EV/Revenue multiple and the upper end assuming the market continues to reward the company’s margin and cash conversion. That range sits below the analyst mean target of $69.6 and well below the $94 high, so my view is more conservative than consensus because I weight the 7.0 PEG ratio and the fact that the stock has already rerated more heavily than the target-price set appears to. The forward EPS of 5.03 also implies a forward P/E of 8.7x, which is not demanding on an absolute basis, but it is not a deep discount once I factor in the 45.5% 52-week gain and the 7.1% FCF yield. In other words, the stock looks reasonably priced for quality, not cheap enough for me to call it a clear bargain.
Leverage
PAAS — Leverage & Coverage (Quarterly)
| Metric | Value |
|---|---|
| Total Debt/Equity % (mrq) | 11.5 |
| Current Ratio (mrq) | 2.8 |
| Total Debt (mrq, USD Mil) | 845 |
| Operating Cash Flow (TTM, USD Mil) | 1,661 |
| Levered Free Cash Flow (TTM, USD Mil) | 1,300.1 |
| Net Debt/EBITDA (TTM) | -0.4 |
| FCF Margin % (TTM) | 32.5% |
Source: Yahoo Finance — Quarterly Financial Statements
The balance sheet is a clear support. Total debt/equity is 11.5%, current ratio is 2.8, and total debt is $845M, while operating cash flow reached $1.7B and levered free cash flow was $1.3B over the trailing twelve months. Net debt/EBITDA of -0.4 and a 32.5% FCF margin tell me the company is generating enough cash to keep leverage modest even if conditions soften. That is important because the equity case here depends on cash conversion staying strong; if free cash flow were to weaken materially, the valuation would lose one of its main supports.
Insider Activity
Insider ownership is 7.0%, while institutional ownership is 61.2%, so the stock is primarily in institutional hands rather than being tightly controlled by insiders. I do not read that as a major signal by itself, but it does mean the market will likely react quickly to any change in operating momentum or capital allocation.
Comparable Analysis
Growth
| Company | Revenue TTM (USD Mil) | Revenue Growth YoY % | Diluted EPS TTM |
|---|---|---|---|
| PAAS | 4,000 | 49.3% | 3.2 |
| AG | 1,489.9 | 95.4% | 0.6 |
| SBSW | 129,677 | 31.6% | -0.5 |
| AEM | 13,539.2 | 66.1% | 10.6 |
| HL | 1,629.1 | 100.4% | 0.7 |
Source: Yahoo Finance
Pan American Silver’s revenue growth of 49.3% TTM sits below AG at 95.4% and HL at 100.4%, but above AEM at 66.1% and SBSW at 31.6%. I think that is a fair middle ground for a company already at $4B of TTM revenue, because larger scale usually makes triple-digit growth harder to sustain.
Valuation
| Company | Trailing P/E | Forward P/E | EV/Revenue | EV/EBITDA | Price/Sales (TTM) | Price/Book (mrq) | Market Cap (USD Mil) | Enterprise Value (USD Mil) | Beta (5Y Monthly) | FCF Yield % (TTM) | Forward EPS | Analyst Target Price – Low | Analyst Target Price – Mean | Analyst Target Price – High | # Analyst Opinions |
|---|---|---|---|---|---|---|---|---|---|---|---|---|---|---|---|
| PAAS | 13.8 | 8.7 | 4.5 | 9.2 | 4.6 | 2.5 | 18,375 | 17,822 | 1.54 | 7.1% | 5 | 53 | 69.6 | 94 | 8 |
| AG | 29 | 14.8 | 5.4 | 10.1 | 5.7 | 2.9 | 8,443 | 8,068 | 2.11 | 7.7% | 1.2 | 23 | 26.9 | 30.8 | 2 |
| SBSW | — | 2.3 | 0.3 | 1.3 | 0 | 4.9 | 6,141 | 43,482 | 0.86 | 16.6% | 3.7 | 9.2 | 13.6 | 16.6 | 4 |
| AEM | 13.4 | 10.6 | 5.3 | 7.5 | 5.4 | 2.8 | 73,250 | 71,717 | 0.59 | 5.9% | 13.8 | 87 | 233.9 | 310 | 14 |
| HL | 21.8 | 13.1 | 6.3 | 11.7 | 6.5 | 4.1 | 10,517 | 10,269 | 1.29 | 2.6% | 1.2 | 19 | 25.2 | 32 | 9 |
Source: Yahoo Finance
On valuation, PAAS trades at 4.5x EV/Revenue and 9.2x EV/EBITDA, versus AG at 5.4x and 10.1x, HL at 6.3x and 11.7x, and AEM at 5.3x and 7.5x. The 7.1% FCF yield is better than AEM’s 5.9% and HL’s 2.6%, and it is close to AG’s 7.7%, so the market is not paying a premium for PAAS on cash generation. A $1 investment one year ago would be worth $1.54 in PAAS, versus $2.04 in AG, $1.28 in AEM, $2.74 in HL, and $1.17 in SBSW, which tells me the stock has already participated in the sector rerating but has not been the strongest momentum name. That is why I think the valuation is fair rather than cheap: the market is rewarding the cash profile, but not ignoring the fact that the shares have already moved.
Profitability
| Company | Operating Margin (TTM) | Net Margin (TTM) | Return on Assets (TTM) | Return on Equity (TTM) | Gross Margin (TTM) | EBITDA Margin (TTM) |
|---|---|---|---|---|---|---|
| PAAS | 48.1% | 31.6% | 10.6% | 20.8% | 55.7% | 48.6% |
| AG | 49.5% | 19.5% | 8.0% | 11.5% | 59.7% | 53.6% |
| SBSW | 13.5% | -4.0% | 4.4% | -10.3% | 24.6% | 26.4% |
| AEM | 62.8% | 39.5% | 15.5% | 22.3% | 73.9% | 70.5% |
| HL | 55.5% | 16.8% | 13.8% | 19.9% | 59.6% | 53.8% |
Source: Yahoo Finance
PAAS’s 48.1% operating margin and 31.7% net margin compare favorably with AG at 49.5% and 19.5%, HL at 55.5% and 16.8%, and SBSW at 13.5% and -4.0%. AEM is stronger at 62.8% operating margin and 39.5% net margin, so PAAS is not best in class, but it is clearly in the upper tier. I also note that PAAS’s 20.8% ROE and 10.6% ROA are solid without looking leverage-driven, which makes the return profile more durable than SBSW’s.
Leverage
| Company | Total Debt/Equity % (mrq) | Current Ratio (mrq) | Total Debt (mrq, USD Mil) | Operating Cash Flow TTM (USD Mil) | Free Cash Flow TTM (USD Mil) | Net Debt/EBITDA (TTM) | FCF Margin % (TTM) |
|---|---|---|---|---|---|---|---|
| PAAS | 11.5 | 2.8 | 845 | 1,661 | 1,300.1 | -0.4 | 32.5% |
| AG | 9.5 | 2.7 | 314 | 707 | 648.2 | -1 | 43.5% |
| SBSW | 99.4 | 1.8 | 43,904 | 21,709 | 1,016.6 | 0.8 | 0.8% |
| AEM | 1.2 | 3.1 | 319.2 | 7,118.7 | 4,282.9 | -0.3 | 31.6% |
| HL | 11.1 | 4.9 | 285.1 | 721.1 | 277.1 | -0.4 | 17.0% |
Source: Yahoo Finance
PAAS’s net debt/EBITDA of -0.4 and current ratio of 2.8 put it in the conservative part of the peer set, though AG is slightly better on net debt/EBITDA at -1.0 and AEM has a stronger current ratio at 3.1. SBSW stands out on the other side of the ledger with 99.4% debt/equity and 0.8 net debt/EBITDA, which is a very different risk profile. The important cross-check is that PAAS combines moderate leverage with a 32.5% FCF margin, so the balance sheet is not just safe in isolation; it is being supported by real cash generation.
Conclusion
I would put my rating as a Hold because the stock already reflects a lot of the company’s margin strength, and the key question now is whether the recent earnings step-up can persist. The bull case is straightforward: if quarterly EBITDA stays above $778M and revenue holds near the $1.2B level rather than slipping back toward $773M, then the current multiple should look more defensible because the company would be proving that its cash engine has reset higher. The bear case is just as clear: if free cash flow margin falls materially below 32.5%, the valuation loses support quickly, because the market is paying for cash conversion as much as for earnings growth.
I do not think the downside is imminent, but I also do not see enough evidence to move off Hold today. The balance sheet and profitability profile give the stock a solid floor, yet the shares have already rerated enough that I want either a cleaner reacceleration in EBITDA or a better entry point before becoming more constructive.
What’s your take? I rated Pan American Silver (PAAS) HOLD above — but the goal here is to get this right, not just to publish an opinion. What would you add to this analysis, or which risk or catalyst do you think I’m under- or over-weighting? Tell me in the comments.
Data sourced from Yahoo Finance and SEC EDGAR. Not investment advice.
Leave a Comment