
| Company | Oct 25 | Nov 25 | Dec 25 | Jan 26 | Feb 26 | Mar 26 | Apr 26 | May 26 | Jun 26 | Jul 26 | Aug 26 | Sep 26 | 12-Mo |
|---|---|---|---|---|---|---|---|---|---|---|---|---|---|
| HON | +1% | -4% | +2% | +17% | +8% | -7% | -5% | +12% | -10% | +9% | -12% | -1% | +3% |
| GD | +2% | -1% | -1% | +5% | +2% | -4% | +1% | +1% | +2% | +9% | -3% | -11% | -1% |
| LHX | -5% | -3% | +5% | +17% | +6% | -5% | -7% | -2% | -7% | -5% | -4% | -11% | -21% |
| GE | +3% | -3% | +3% | -0% | +12% | -17% | +2% | +12% | +15% | -4% | -7% | -7% | +4% |
| EMR | +6% | -4% | -0% | +11% | +3% | -13% | +7% | +3% | -0% | +5% | +2% | +2% | +20% |
| TT | +6% | -6% | -8% | +8% | +10% | -10% | +18% | -8% | +9% | -7% | -2% | +2% | +8% |
Source: Yahoo Finance monthly adjusted close.
Quick Thesis
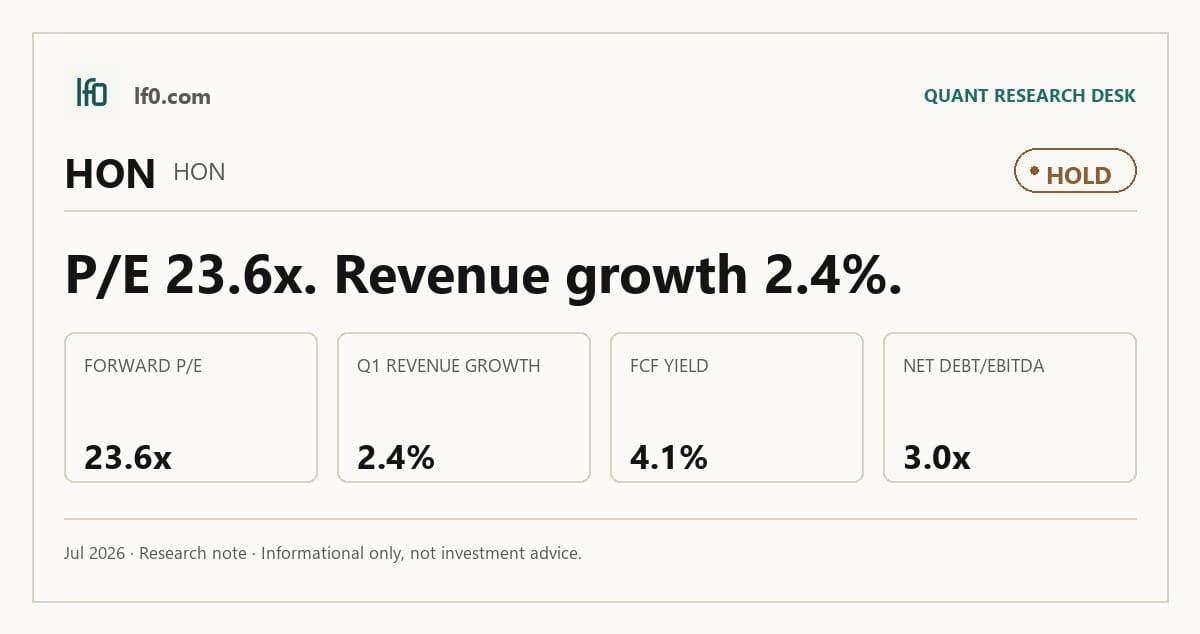
- Rated Hold — the stock already reflects solid margins, but growth is too uneven for a rerating.
- Strongest strength: TTM operating margin of 20.3% and EBITDA margin of 22.4%.
- Main risk: 3.03x net debt/EBITDA, with only 6.9% TTM FCF margin.
- Valuation is mixed: 11.0x EV/EBITDA and 21.7x forward P/E are not cheap.
- I would turn more constructive if quarterly revenue stays above 9.5B and EBITDA above 1.6B.
Performance Since Our Last Call
The prior call was Hold, published on 2026-07-07. Since that entry, the stock has returned -4.6%, which leaves the verdict in the Hold range.
That performance is broadly consistent with the fresh evidence here: profitability remains strong, but the latest revenue path is still choppy and leverage is high enough to cap upside. I do not see a clean break from the prior setup, so this article keeps the same stance rather than forcing a change.
Executive Summary
Rating: HOLD | HON
Measured from adjusted close on 2026-07-07 to 2026-10-06. Sell ratings are correct when the stock falls; Hold is tracked as a +/-10% range. Daily-close data, not intraday. Calls are tracked for 182 days from publication, then frozen as a final record.
I would put my rating as a Hold because Honeywell’s margin profile is good enough to support the current multiple, but the latest revenue pattern is too uneven for me to pay for a cleaner rerating. TTM operating margin of 20.3% and EBITDA margin of 22.4% are solid, yet the Q4 2025 revenue dip to 6.9B and the Q2 2026 rebound to 9.7B show that the earnings base is still lumpy.
I would raise my rating more toward a Buy if revenue can hold above 9.5B in the next two quarters, because that would show the Q4 2025 drop was an isolated reset rather than a demand break, and if EBITDA stays above 1.6B per quarter, roughly the Q1 2026 level, that would tell me the business can keep converting sales into cash at a rate that supports deleveraging. On the cash side, a move in FCF margin from 6.9% to about 8.0% would add roughly $420M of annual free cash flow on the current revenue base, which would make the 3.0x net debt/EBITDA load easier to carry.
Company Profile
Honeywell is a diversified industrial and technology company with exposure to aerospace, building automation, process automation, and industrial automation. The June 2026 separation plan makes that mix more visible, and in my view the cleaner structure should help investors judge each business on its own economics rather than on a blended conglomerate multiple.
Economic Moat
Business Model
Honeywell’s moat is not a single product franchise so much as a portfolio of installed-base businesses that tend to generate recurring service, upgrade, and replacement demand. That structure usually supports steadier margins than a pure project business, and the 20.3% operating margin suggests the model still has pricing and scale discipline behind it.
Business & Operating Risks
The main disclosed risks are execution risk around the planned Aerospace Technologies spin-off, balance-sheet leverage, and the possibility that a more cyclical industrial mix could make earnings less smooth than the headline margins suggest. The June 29 reverse split is also a reminder that management is actively reshaping the capital structure, which can help trading mechanics but does not reduce operating risk by itself. I do not think these risks break the moat, but they do test whether the installed-base advantage can keep producing cash while the company is being reassembled.
Management Discussion & Analysis
Management is clearly responding to those risks by separating Aerospace Technologies, recasting segment reporting, and simplifying the equity structure ahead of the spin. That is the right response to the structural complexity, but it does not yet answer the more important question of whether the post-spin businesses can sustain the current cash conversion rate without the support of a blended balance sheet.
Recent Events
The June 5, 2026 decision to proceed with the Aerospace Technologies spin-off is the most important recent event because it should let investors value the aerospace business on its own merits. The June 15 record date and June 29 distribution date matter because they define when the separation becomes real, not just announced. Honeywell also named Jillian Evanko, chief executive officer of Duravant LLC, as an independent director and Audit Committee member on June 1, which is a modest governance positive at a time when the company is executing a major structural change.
Financial Analysis
Growth
HON — Financial Growth (Quarterly, USD Mil)
| Metric | 2025-06-30 | 2025-09-30 | 2025-12-31 | 2026-03-31 | 2026-06-30 |
|---|---|---|---|---|---|
| REVENUE (USD Mil) | 9,322 | 10,408 | 6,860 | 9,143 | 9,719 |
| EBITDA (USD Mil) | 2,304 | 3,078 | 86 | 1,599 | 8,204 |
| NET INCOME (USD Mil) | 1,570 | 1,825 | -115 | 821 | 5,682 |
| DILUTED EPS | 4.9 | 5.7 | 0.9 | 2.6 | 17.8 |
Source: Yahoo Finance — Quarterly Financial Statements
Revenue moved from 9.3B in Q2 2025 to 10.4B in Q3 2025, then fell to 6.9B in Q4 2025 before rebounding to 9.1B in Q1 2026 and 9.7B in Q2 2026. I read that as a recovery pattern rather than a clean growth line, and the Q4 dip is the key reason I am not treating the latest rebound as proof of durable acceleration.
EBITDA was even more volatile, falling from 3.1B in Q3 2025 to 86M in Q4 2025 before recovering to 1.6B in Q1 2026 and 8.2B in Q2 2026. That swing is large enough that I would want more disclosure before reading too much into the quarter-to-quarter path, because the latest number looks strong but the series itself is not yet stable.
Profitability
HON — Profitability (TTM)
| Metric | TTM |
|---|---|
| Operating Margin (TTM) | 20.2% |
| Net Margin (TTM) | 21.6% |
| Return on Assets (TTM) | 5.7% |
| Return on Equity (TTM) | 46.6% |
| Gross Margin (TTM) | 36.5% |
| EBITDA Margin (TTM) | 22.4% |
Source: Yahoo Finance — Trailing Twelve Months (TTM)
TTM operating margin of 20.3%, gross margin of 36.5%, and EBITDA margin of 22.4% show a business that already earns solid operating returns. The 16.2-point gap between gross and operating margin tells me overhead and scale costs still matter, but the smaller gap between operating and EBITDA margin suggests depreciation and amortization are not distorting the earnings picture much.
TTM net margin of 21.6% is slightly above operating margin, which implies below-the-line items helped reported earnings over the last twelve months. TTM ROA of 5.7% and ROE of 46.6% show strong capital efficiency, although the wide ROE-to-ROA spread tells me leverage is doing part of the work.
Valuation
HON — Valuation Multiples
| Metric | Value |
|---|---|
| Current Share Price (USD) | 214 |
| Market Cap (USD Mil) | 67,822 |
| Enterprise Value (USD Mil) | 93,901 |
| Trailing P/E | 7.9 |
| Forward P/E | 21.7 |
| Price/Sales (TTM) | 1.8 |
| Price/Book (mrq) | 3.7 |
| EV/Revenue | 2.5 |
| EV/EBITDA | 11 |
| Beta (5Y Monthly) | 0.89 |
| FCF Yield % (TTM) | 3.9% |
| Forward EPS (USD) | 9.9 |
| Analyst Target Price – Low (USD) | 186 |
| Analyst Target Price – Mean (USD) | 258.2 |
| Analyst Target Price – High (USD) | 303 |
| # Analyst Opinions | 23 |
Source: Yahoo Finance
At $214 per share, Honeywell trades at 7.9x trailing P/E, 21.7x forward P/E, 2.5x EV/revenue, and 11.0x EV/EBITDA, with a 3.9% FCF yield. I think that is a fair-to-slightly-rich setup for a business with good margins but only moderate growth, especially because the 3.0x net debt/EBITDA load limits how much of the cash flow can flow straight to equity holders.
On the analysis here, I would put fair value in a range of about $190-$255. That sits inside the analyst target range of 186-$303 and slightly below the 258 mean, which makes sense to me because I weight the leverage and uneven growth profile more heavily than the consensus appears to. Forward EPS of 9.9 also implies a forward multiple of about 21.7x at the current price, so the market is paying for stability rather than for a sharp earnings reacceleration.
Leverage
HON — Leverage & Coverage (Quarterly)
| Metric | Value |
|---|---|
| Total Debt/Equity % (mrq) | 185.4 |
| Current Ratio (mrq) | 1.2 |
| Total Debt (mrq, USD Mil) | 34,955 |
| Operating Cash Flow (TTM, USD Mil) | 5,118 |
| Levered Free Cash Flow (TTM, USD Mil) | 2,610.4 |
| Net Debt/EBITDA (TTM) | 3 |
| FCF Margin % (TTM) | 6.9% |
Source: Yahoo Finance — Quarterly Financial Statements
Honeywell carries $35B of total debt against a 1.21x current ratio and 185.4% debt/equity, so the balance sheet is levered but not in distress. Net debt/EBITDA of 3.0x is manageable for a company with $5.1B of operating cash flow and $2.6B of levered free cash flow over the last twelve months, but it does leave less room for error if margins soften.
That leverage also explains why the equity can look expensive even when the operating business is healthy: the cash engine is real, yet a meaningful share of it is already spoken for by debt service, capex, and working capital. In my view, the balance sheet is the main reason the stock does not deserve a higher multiple today.
Insider Activity
The insider transaction record I see is one-sided: 10 open-market sales and 0 open-market purchases over 2025-02-10 to 2026-06-01. Grace Lieblein accounts for three of the recent sales, so the selling is somewhat concentrated, but it is still broad enough to read as a net negative signal.
Comparable Analysis
LF0 has published standalone analyses of these peers: L3Harris Technologies (LHX) (rated Sell); General Electric (GE) (rated Hold); Emerson (EMR) (rated Hold).
Growth
| Company | Revenue TTM (USD Mil) | Revenue Growth YoY % | Diluted EPS TTM |
|---|---|---|---|
| HON | 38,057 | 4.3% | 27.1 |
| GD | 54,861 | 8.1% | 16.4 |
| LHX | 22,932 | 8.4% | 9.9 |
| GE | 50,639 | 21.1% | 8.5 |
| EMR | 18,636 | 7.0% | 4.6 |
| TT | 22,209.9 | 10.6% | 13.4 |
Source: Yahoo Finance
Honeywell’s 4.3% TTM revenue growth trails GD at 8.1%, LHX at 8.4%, GE at 21.1%, EMR at 7.0%, and TT at 10.6%. That gap matters because the market is not paying Honeywell a growth premium; it is paying for margin quality, which means the stock needs execution on profitability to justify the current valuation.
Valuation
| Company | Current Share Price (USD) | Trailing P/E | Forward P/E | EV/Revenue | EV/EBITDA | Price/Sales (TTM) | Price/Book (mrq) | Market Cap (USD Mil) | Enterprise Value (USD Mil) | Beta (5Y Monthly) | FCF Yield % (TTM) | Forward EPS | Analyst Target Price – Low | Analyst Target Price – Mean | Analyst Target Price – High | # Analyst Opinions |
|---|---|---|---|---|---|---|---|---|---|---|---|---|---|---|---|---|
| HON | 214 | 7.9 | 21.7 | 2.5 | 11 | 1.8 | 3.7 | 67,822 | 93,901 | 0.89 | 3.9% | 9.9 | 186 | 258.2 | 303 | 23 |
| GD | 330.1 | 20.1 | 17.8 | 1.7 | 14.2 | 1.6 | 3.3 | 89,308 | 94,320 | 0.33 | 4.9% | 18.6 | 319 | 420.3 | 465 | 21 |
| LHX | 236.6 | 23.9 | 17.5 | 2.4 | 13.4 | 1.9 | 2.2 | 44,058 | 55,472 | 0.51 | 3.6% | 13.5 | 264 | 335.3 | 405 | 15 |
| GE | 309.6 | 36.5 | 34.1 | 6.5 | 28.9 | 6.3 | 18.2 | 321,188 | 331,700 | 1.37 | 2.1% | 9.1 | 347 | 396.8 | 450 | 21 |
| EMR | 161.6 | 35.4 | 22.2 | 5.5 | 16.8 | 4.9 | 4.4 | 90,518 | 101,783 | 1.21 | 4.1% | 7.3 | 104 | 173.7 | 205 | 28 |
| TT | 463.9 | 34.6 | 26.3 | 4.7 | 24.5 | 4.6 | 11.9 | 102,071 | 105,392 | 1.16 | 3.1% | 17.6 | 422 | 526.7 | 575 | 22 |
Source: Yahoo Finance
Honeywell trades at 7.9x trailing P/E, 21.7x forward P/E, 2.5x EV/revenue, and 11.0x EV/EBITDA, versus GD at 20.1x, 17.8x, 1.7x, and 14.2x; LHX at 23.9x, 17.5x, 2.4x, and 13.4x; GE at 36.5x, 34.1x, 6.5x, and 28.9x; EMR at 35.4x, 22.2x, 5.5x, and 16.8x; and TT at 34.6x, 26.3x, 4.7x, and 24.5x. On FCF yield, Honeywell’s 3.9% sits in the middle of the group, but the low trailing P/E is not a clean bargain signal because the company’s earnings quality is being supported by a leverage-heavy capital structure.
Using peer EV/revenue as a rough guide gives me a wide implied range, which is exactly why I would not anchor on a single multiple here. The cleaner read is that Honeywell looks cheaper than the high-multiple peers, but not cheap enough to ignore the slower growth and heavier debt load.
Profitability
| Company | Operating Margin (TTM) | Net Margin (TTM) | Return on Assets (TTM) | Return on Equity (TTM) | Gross Margin (TTM) | EBITDA Margin (TTM) |
|---|---|---|---|---|---|---|
| HON | 20.2% | 21.6% | 5.7% | 46.6% | 36.5% | 22.4% |
| GD | 10.4% | 8.2% | 6.1% | 17.8% | 15.4% | 12.1% |
| LHX | 12.6% | 8.2% | 4.4% | 9.3% | 25.5% | 18.1% |
| GE | 20.6% | 17.7% | 5.1% | 48.2% | 31.1% | 22.7% |
| EMR | 26.9% | 13.8% | 6.9% | 12.8% | 53.2% | 32.5% |
| TT | 19.3% | 13.3% | 11.0% | 36.6% | 35.4% | 19.4% |
Source: Yahoo Finance
Honeywell’s 20.3% operating margin and 22.4% EBITDA margin are ahead of GD, LHX, and TT, while its 21.6% net margin is also stronger than most of the group. GE is the closest comp on operating margin, but Honeywell still looks better on net margin, which tells me the business is doing a good job converting scale into bottom-line earnings.
Leverage
| Company | Total Debt/Equity % (mrq) | Current Ratio (mrq) | Total Debt (mrq, USD Mil) | Operating Cash Flow TTM (USD Mil) | Free Cash Flow TTM (USD Mil) | Net Debt/EBITDA (TTM) | FCF Margin % (TTM) |
|---|---|---|---|---|---|---|---|
| HON | 185.4 | 1.2 | 34,955 | 5,118 | 2,610.4 | 3 | 6.9% |
| GD | 35.3 | 1.4 | 9,479 | 7,694 | 4,400.1 | 0.8 | 8.0% |
| LHX | 52.8 | 1.2 | 10,999 | 3,292 | 1,609 | 2.3 | 7.0% |
| GE | 113.2 | 1 | 20,230 | 9,800 | 6,594.6 | 0.9 | 13.0% |
| EMR | 67.7 | 0.9 | 13,802 | 3,912 | 3,706.2 | 1.9 | 19.9% |
| TT | 53.4 | 1.1 | 4,616.8 | 3,876.8 | 3,121.7 | 0.8 | 14.1% |
Source: Yahoo Finance
Honeywell’s 185.4% debt/equity and 3.0x net debt/EBITDA are heavier than GD, LHX, EMR, and TT, while its 6.9% FCF margin is also below most of the peer set. That combination matters because the company’s margin advantage is real, but it is partly offset by a balance sheet that gives less room for execution error than the cleaner peers.
Conclusion
I would put my rating as a Hold because Honeywell’s profitability is strong enough to support the current valuation, but the growth path is still too uneven for me to call the stock a Buy. The key tension is that the business is already producing a 20.3% operating margin and 6.9% FCF margin, yet the Q4 2025 revenue drop to 6.9B and the 3.0x net debt/EBITDA load tell me the rerating case still depends on proof, not promise.
I would raise my rating more toward a Buy if revenue stays above 9.5B for another two quarters and EBITDA holds above 1.6B, because that would show the Q4 disruption was temporary and that the company can keep turning sales into cash while it deleverages. I would also become more constructive if FCF margin moves toward 8.0%, since that would add roughly $420M of annual free cash flow and make the current balance sheet easier to carry.
On the other hand, I would move from Hold to Sell if revenue slips back below 9B or EBITDA falls under 1.2B, because that would tell me the rebound was not durable and that leverage is still sitting on top of a fragile earnings base. If cash conversion weakens toward 5.0% FCF margin, the stock would lose one of the few supports that currently keeps the valuation from looking stretched.
Weighing both sides, I still lean to Hold. The margin base is real, the spin-off could improve transparency, and the balance sheet is serviceable, but I want to see the next few quarters confirm that the latest rebound is the start of a cleaner run rather than another short-lived move.
What to Watch Next
- Revenue above 9.5B for two more quarters — would support a move toward Buy.
- EBITDA above 1.6B per quarter — would confirm the cash engine is holding up.
- FCF margin near 8.0% — would improve balance-sheet flexibility.
- Net debt/EBITDA moving below 3.0x — would reduce financing risk.
- Post-spin reporting clarity — would help prove the separation is improving transparency.
What’s your take? I rated Honeywell (HON) HOLD above — but the goal here is to get this right, not just to publish an opinion. What would you add to this analysis, or which risk or catalyst do you think I’m under- or over-weighting? Tell me in the comments.
Sources
- SEC 8-K Filing (2026-06-05)
- SEC 8-K Filing (2026-06-02)
- SEC 8-K Filing (2026-05-27)
- SEC 8-K Filing (2026-04-23)
- SEC 8-K Filing (2026-04-23)
- SEC 8-K Filing (2026-03-23)
- SEC Form 4 Insider Transaction (2026-06-03)
- SEC Form 4 Insider Transaction (2026-06-03)
- SEC Form 4 Insider Transaction (2026-05-26)
Data sourced from Yahoo Finance and SEC EDGAR. Not investment advice.
Leave a Comment