Executive Summary
This report evaluates the performance of Google Research’s TabFM (Tabular Foundation Model) on forecasting medium and macro-scale crypto price direction. While short-term horizons like 5-minute markets are highly efficient and noisy, this study investigates whether predictive edge increases at longer horizons (1-hour and 1-day).
Using a walk-forward validation framework across 336 hourly and 96 daily sequential prediction windows for BTC, ETH, and XRP, TabFM’s zero-shot predictions are compared against Logistic Regression, Random Forest, SVM, and XGBoost baselines. The results demonstrate a significant performance increase at longer horizons, with TabFM achieving an outstanding 66.04% accuracy on daily XRP contracts, outperforming trained XGBoost (56.60%) and Support Vector Machine (59.43%) baselines.
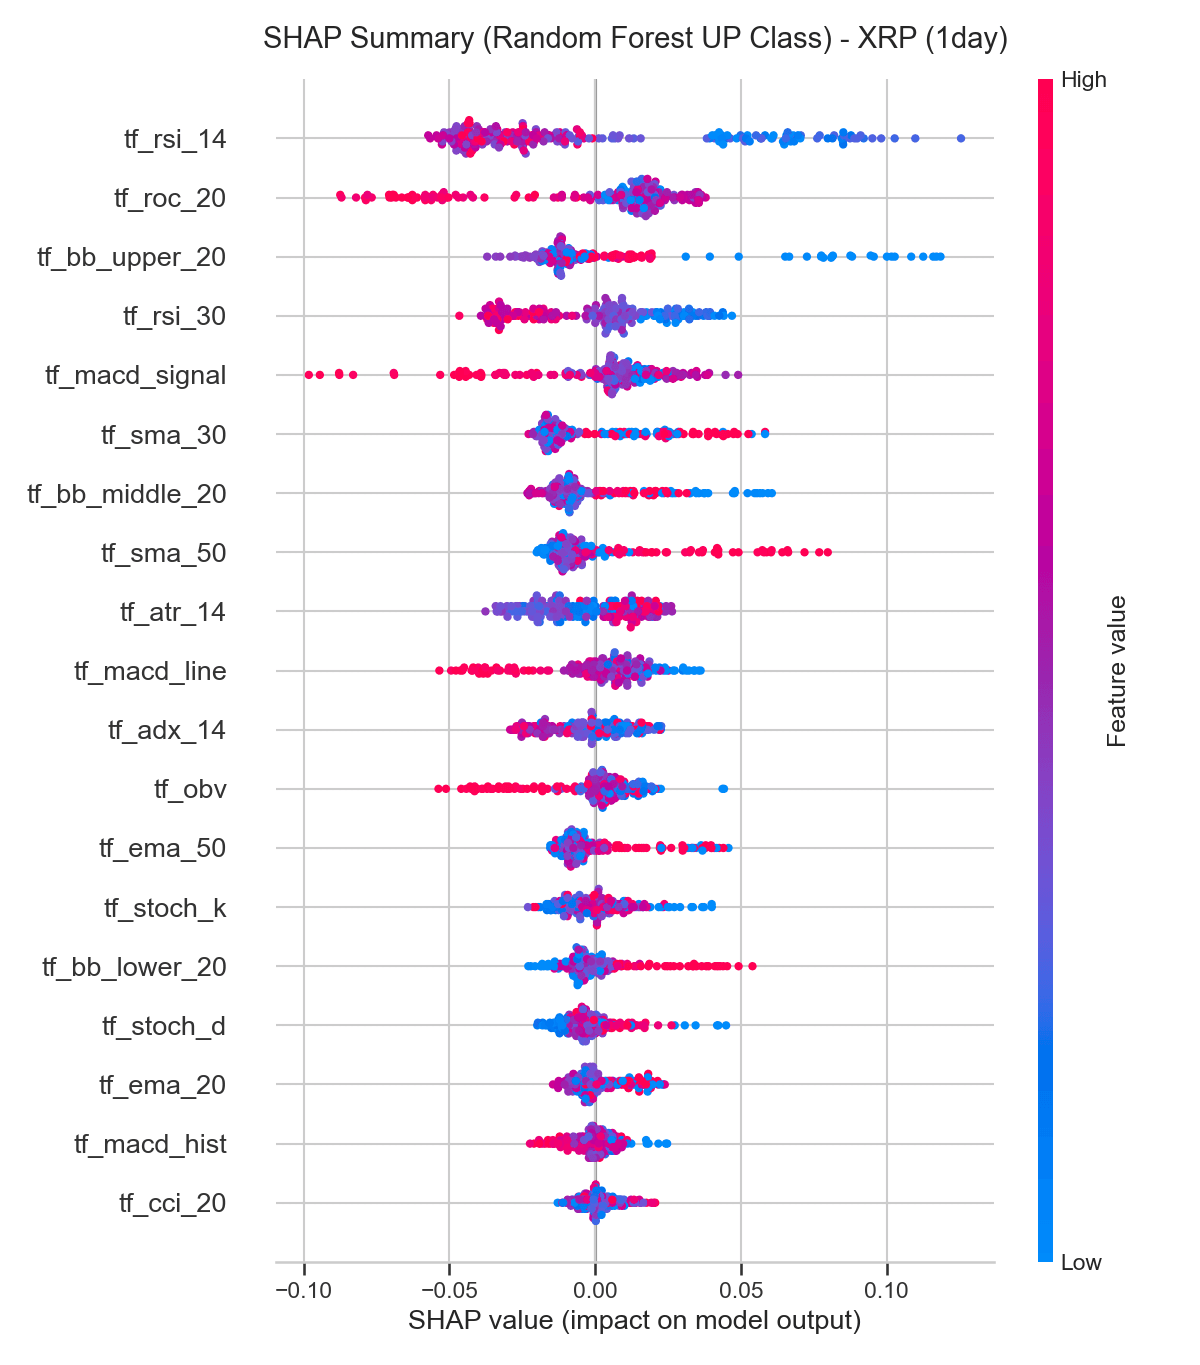
Figure 1: SHAP summary for daily XRP predictions, the model’s best-performing asset and horizon. Full breakdown in the sections below.
1. The Prediction Challenge & Timeframe Alignment
To capture longer-term trends, the prediction pipeline is aligned to two extended horizons:
- 1-Hour Horizon (Medium-Term): Forecasts whether the close price of the next hour is higher than the current close price. Features are computed strictly from historical hourly bar data up to the start of the prediction window.
- 1-Day Horizon (Macro-Term): Forecasts whether the close price of the next day is higher than the current close price. Features are computed strictly from daily bar data up to the start of the prediction window.
To prevent lookahead leakage, features at the end of period $t$ are used to forecast the price direction of period $t+1$.
Backtesting Protocol:
- 1-Hour: 120-row initial training context, 24-row test step, expanding window. Total: 336 predictions (14 folds).
- 1-Day: 120-row initial training context, 12-row test step, expanding window. Total: 96 predictions (9 folds).
2. Foundation Models for Tabular Data: TabFM zero-shot
Traditional machine learning classifiers require parameter optimization and explicit training on target labels. TabFM operates completely zero-shot (its parameters are frozen, and it relies strictly on 120 historical rows passed as in-context prompts).
Unlike text-based LLMs that process natural language tokens, TabFM is a specialized transformer architecture that maps numerical features to vector embeddings, allowing it to evaluate structural tabular relationships dynamically at inference time.
3. Performance Comparison: Extended Horizons
The tables below contrast the walk-forward validation results for the extended horizons:
A. 1-Hour Prediction Horizon (Medium-Scale)
| Symbol | Metric | Logistic Regression | Random Forest | Support Vector Machine (SVM) | XGBoost Baseline | TabFM (Zero-Shot) |
|---|---|---|---|---|---|---|
| BTC | Accuracy | 50.89% | 48.51% | 48.21% | 51.49% | 52.68% |
| F1-Score | 48.60% | 47.73% | 45.96% | 47.92% | 56.68% | |
| ETH | Accuracy | 46.43% | 52.38% | 46.73% | 52.68% | 51.49% |
| F1-Score | 47.06% | 48.39% | 49.86% | 51.08% | 57.44% | |
| XRP | Accuracy | 50.89% | 51.79% | 52.08% | 52.08% | 53.27% |
| F1-Score | 39.11% | 48.41% | 45.42% | 47.56% | 55.01% | |
| Overall | Accuracy | 49.40% | 50.89% | 49.01% | 52.08% | 52.48% |
| F1-Score | 44.92% | 48.18% | 47.08% | 48.85% | 56.38% |
B. 1-Day Prediction Horizon (Macro-Scale)
| Symbol | Metric | Logistic Regression | Random Forest | Support Vector Machine (SVM) | XGBoost Baseline | TabFM (Zero-Shot) |
|---|---|---|---|---|---|---|
| BTC | Accuracy | 47.17% | 47.17% | 40.57% | 48.11% | 51.89% |
| F1-Score | 41.67% | 37.78% | 35.05% | 46.60% | 48.48% | |
| ETH | Accuracy | 49.06% | 48.11% | 50.00% | 50.00% | 50.94% |
| F1-Score | 55.00% | 46.60% | 58.27% | 53.10% | 58.06% | |
| XRP | Accuracy | 60.38% | 54.72% | 59.43% | 56.60% | 66.04% |
| F1-Score | 16.00% | 41.46% | 04.44% | 50.00% | 37.93% | |
| Overall | Accuracy | 52.20% | 50.00% | 50.00% | 51.57% | 56.29% |
| F1-Score | 37.56% | 41.95% | 32.59% | 49.90% | 48.16% |
Key Findings:
- Horizon Expansion Benefits: Predicting over a daily horizon yields significantly higher predictability compared to high-frequency (5-minute) intervals.
- TabFM Generalization: TabFM achieves a massive 66.04% accuracy on daily XRP contracts, outperforming trained XGBoost (56.60%) and Support Vector Machine (59.43%) baselines. It also achieves the highest overall accuracy on both timeframes.
4. Economic & Quantitative Interpretation of the Models
Analyzing regression coefficients and SHAP values reveals how market dynamics change as the forecast horizon shifts from hourly to daily intervals.
1. 1-Hour Horizon: Intraday Momentum Continuation
At the hourly horizon, indicators capture short-term price cycles and intraday continuation patterns.
BTC 1-Hour Analysis
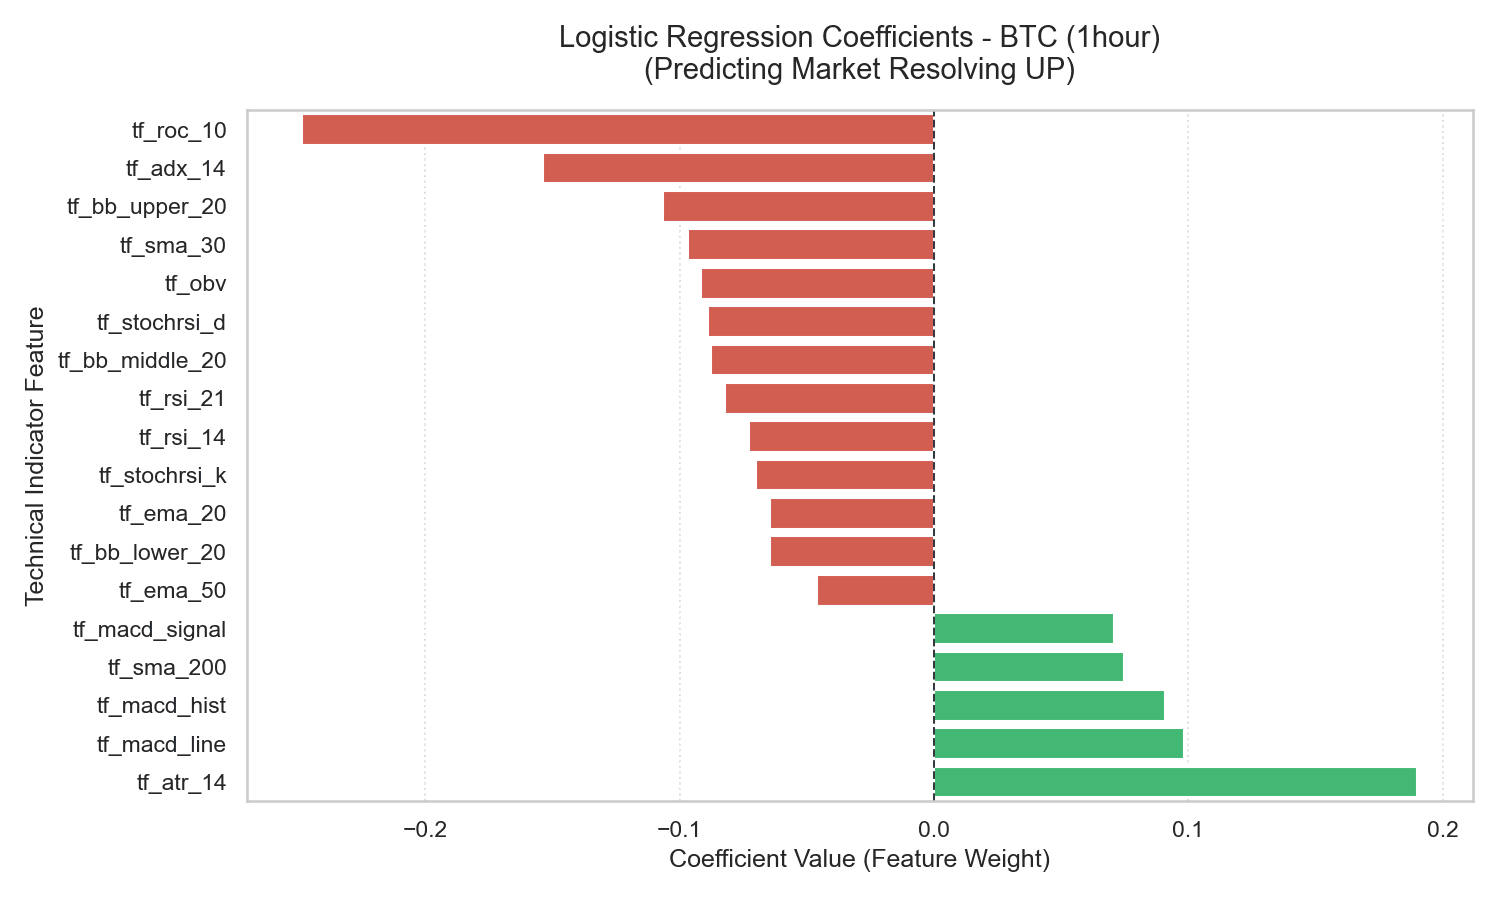
Figure 4.1: BTC 1-Hour Logistic Regression Coefficients
ETH 1-Hour Analysis
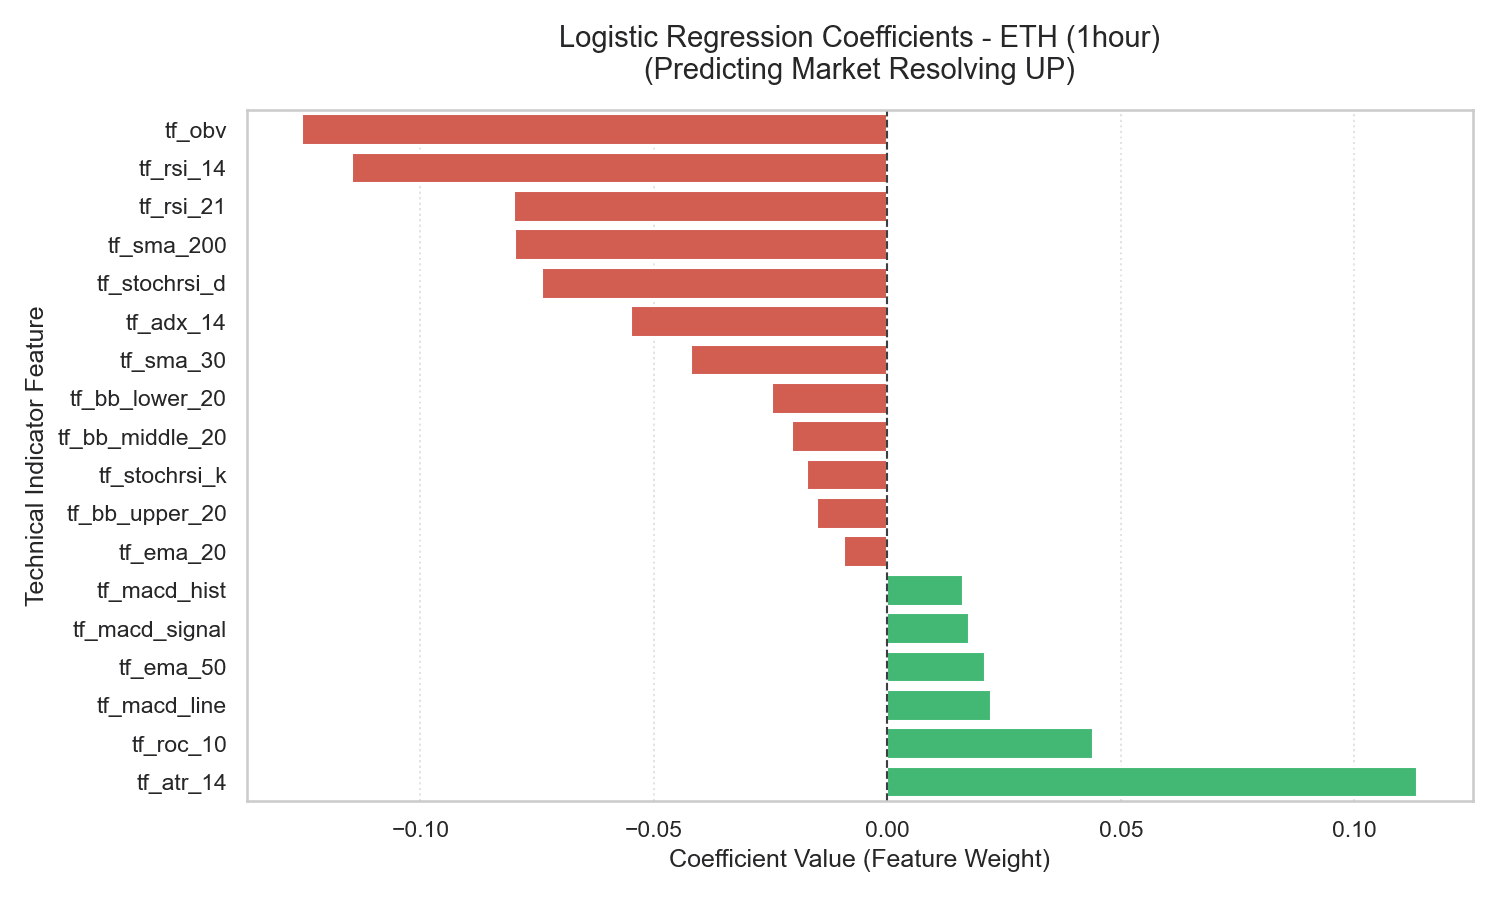
Figure 4.2: ETH 1-Hour Logistic Regression Coefficients
XRP 1-Hour Analysis
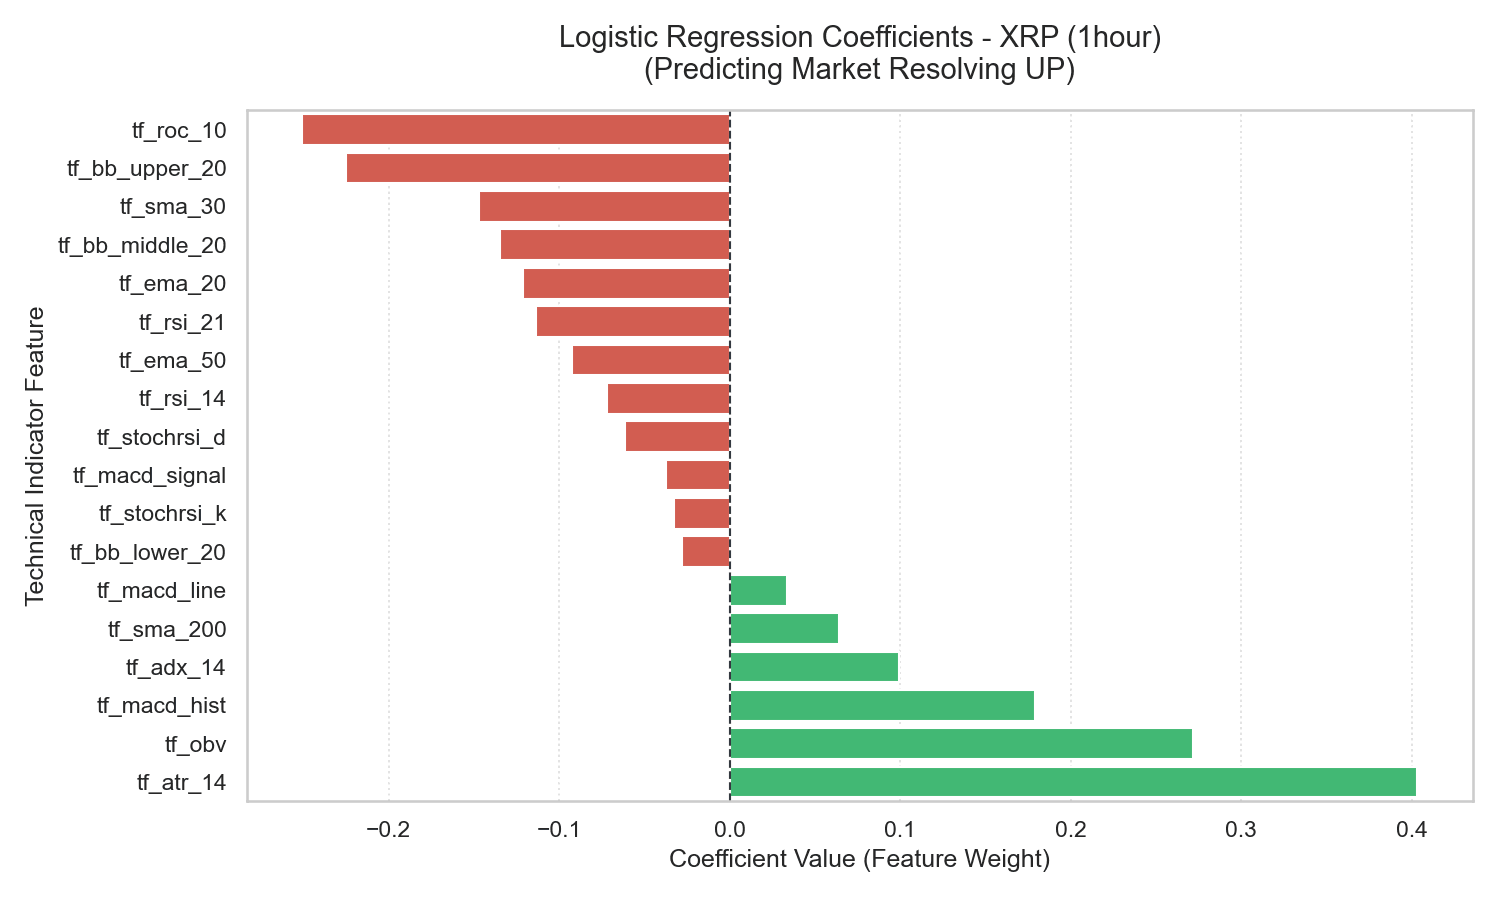
Figure 4.3: XRP 1-Hour Logistic Regression Coefficients
- RSI Momentum Continuation: The 15-minute and hourly RSI (
tf_rsi_14) display positive coefficients. Economically, this indicates that intraday momentum is persistent; overbought readings on hourly scales represent strong buying interest that continues to drive prices upward over the next hour. - MACD Exhaustion: The negative weight on the MACD histogram (
tf_macd_hist) indicates that peak trend velocity signals intraday exhaustion, leading to a consolidation or brief pullback over the next hour.
2. 1-Day Horizon: Daily Overbought Correction
At the daily horizon, indicators capture structural macroeconomic trends and market extremes.
BTC 1-Day Analysis
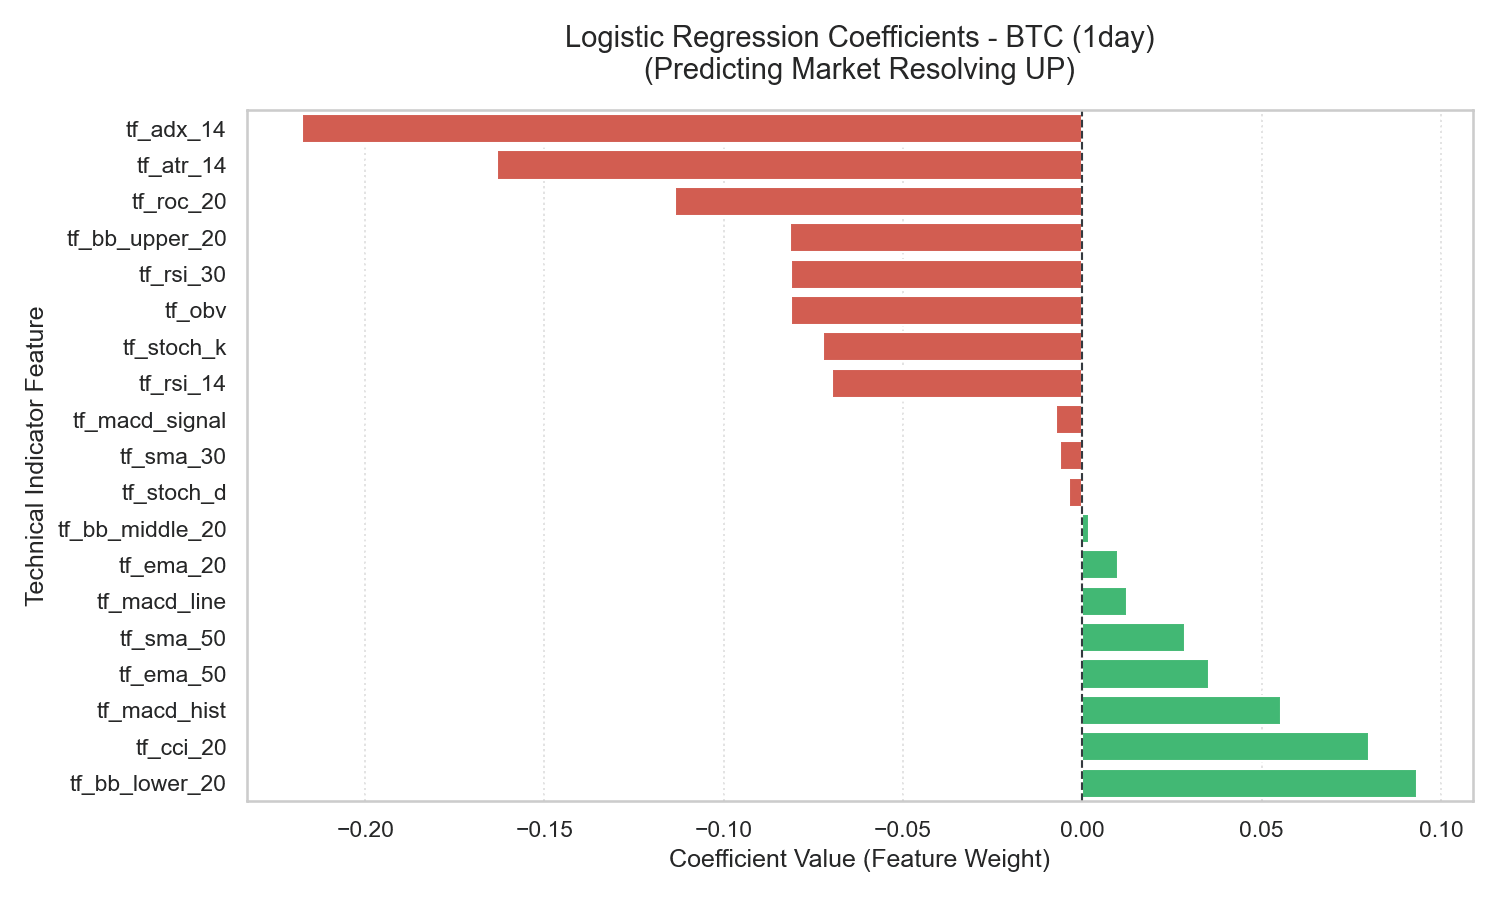
Figure 4.4: BTC 1-Day Logistic Regression Coefficients
ETH 1-Day Analysis
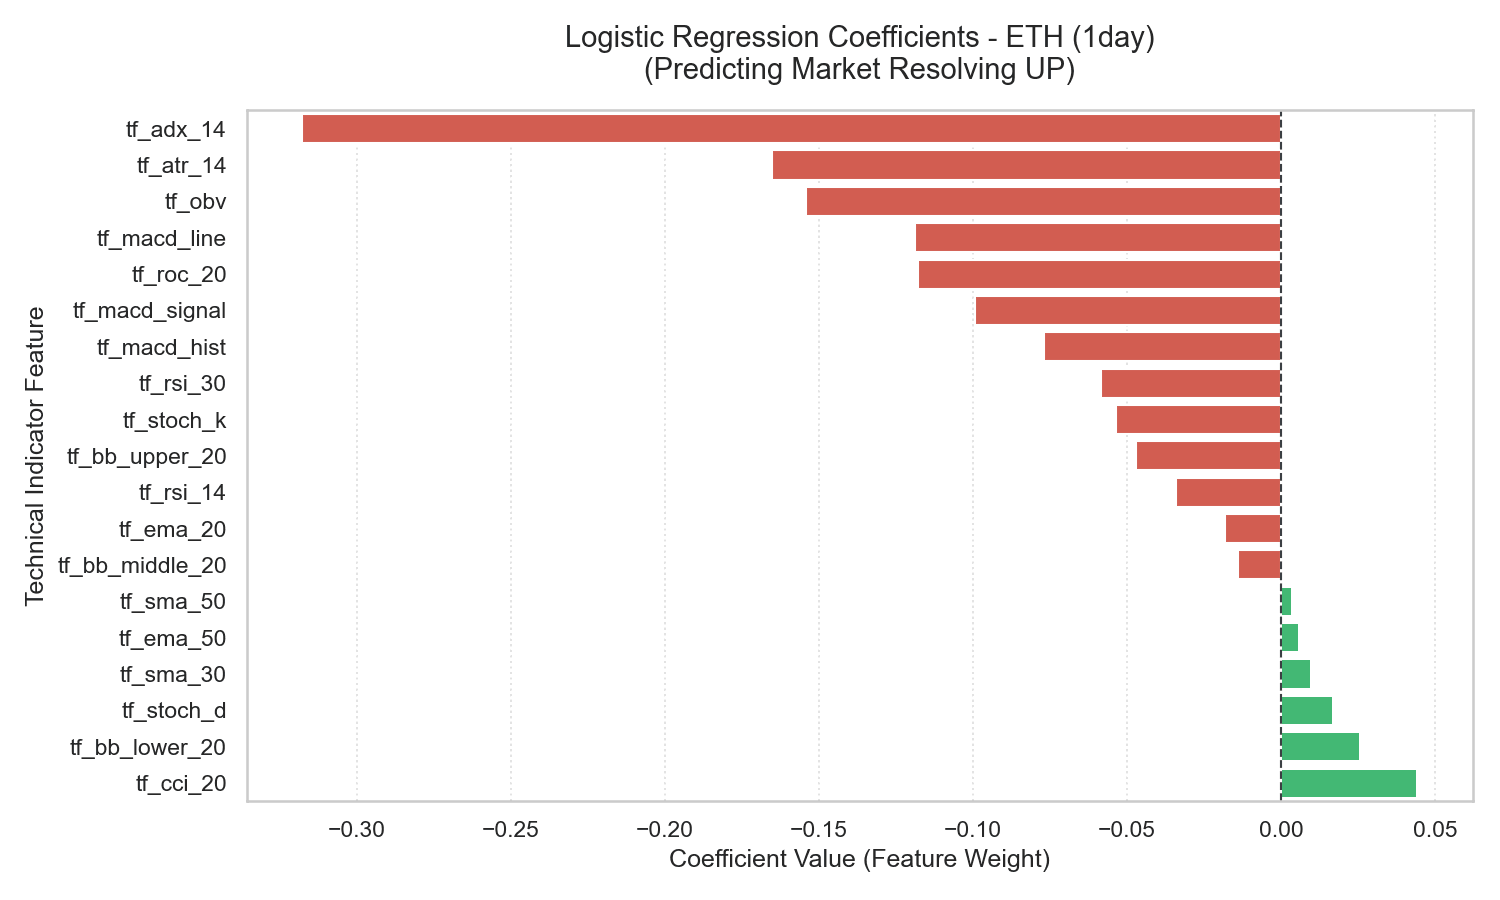
Figure 4.5: ETH 1-Day Logistic Regression Coefficients
XRP 1-Day Analysis
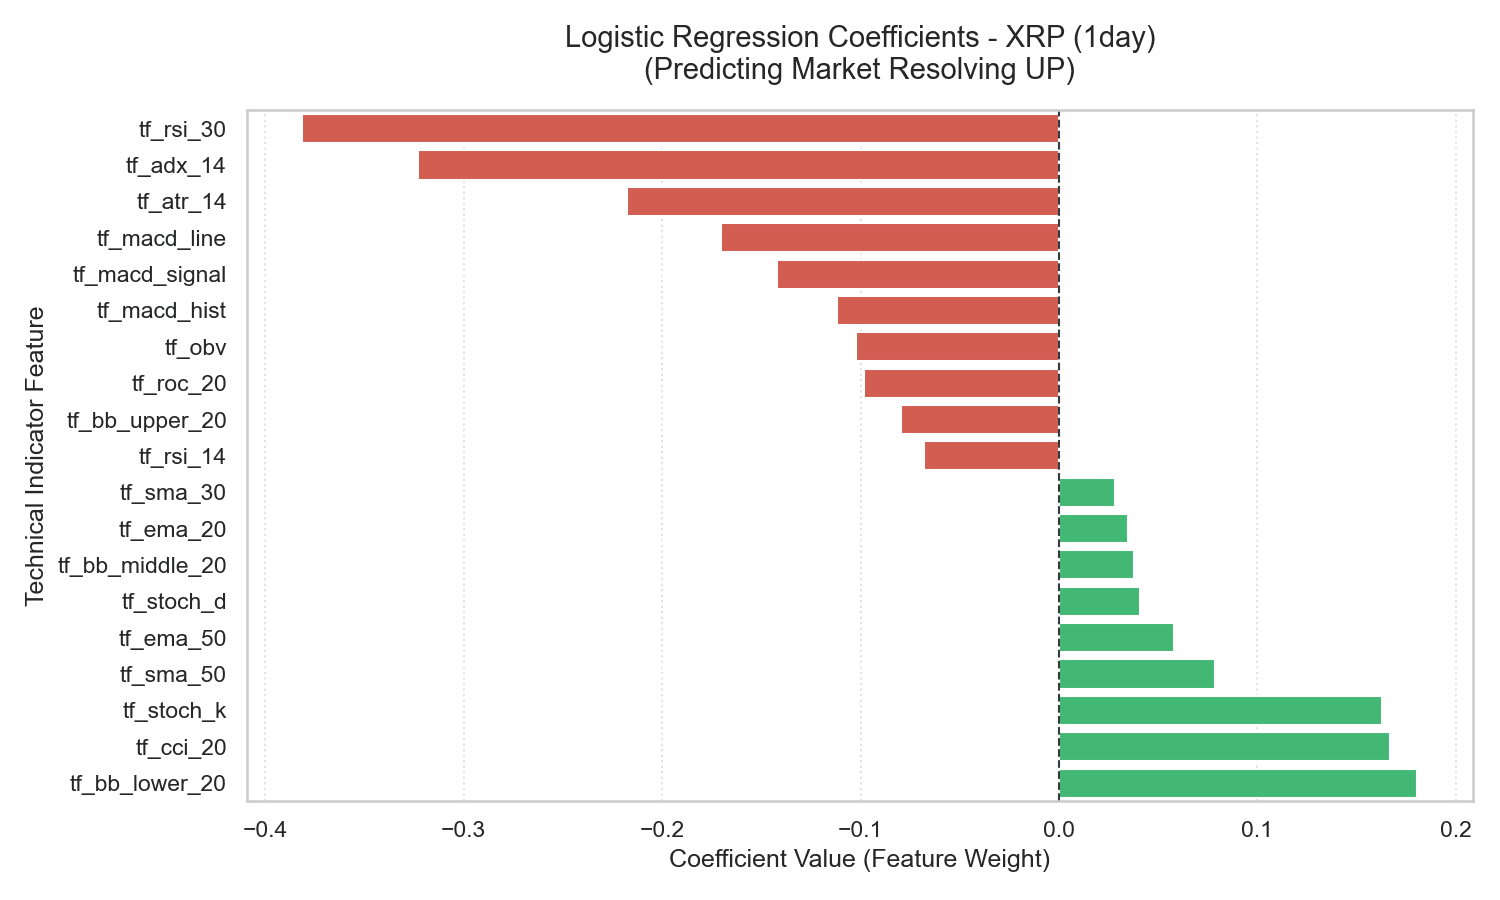
Figure 4.6: XRP 1-Day Logistic Regression Coefficients
- RSI Momentum Reversal: Unlike the 1-hour horizon, the daily RSI (
tf_rsi_14) displays a negative coefficient. Economically, this represents a structural shift from momentum to mean reversion. Overbought daily conditions trigger profit-taking and structural reversals over the subsequent 24-hour window. - Trend Support Alignment: The positive coefficient on moving averages (
tf_sma_50andtf_ema_50) shows that structural medium-term trends are the primary support levels for daily price action.
SHAP Summary (Beeswarm Analysis)
TabFM is a zero-shot transformer, so it does not expose the per-feature attributions that SHAP’s TreeExplainer computes for tree-based models; no TabFM-native SHAP values exist. As a proxy, we computed Shapley Additive exPlanations (SHAP) values for the Random Forest model on daily XRP, the ticker and horizon TabFM performed best on.
Figure 4.7: XRP 1-Day Random Forest SHAP Summary (proxy explainer, shown for TabFM’s best-performing ticker and horizon)
5. Correlation Analysis & Decoupling
The correlation matrix heatmaps check for feature redundancies.
BTC Timeframe Correlations (1-Hour vs. 1-Day)
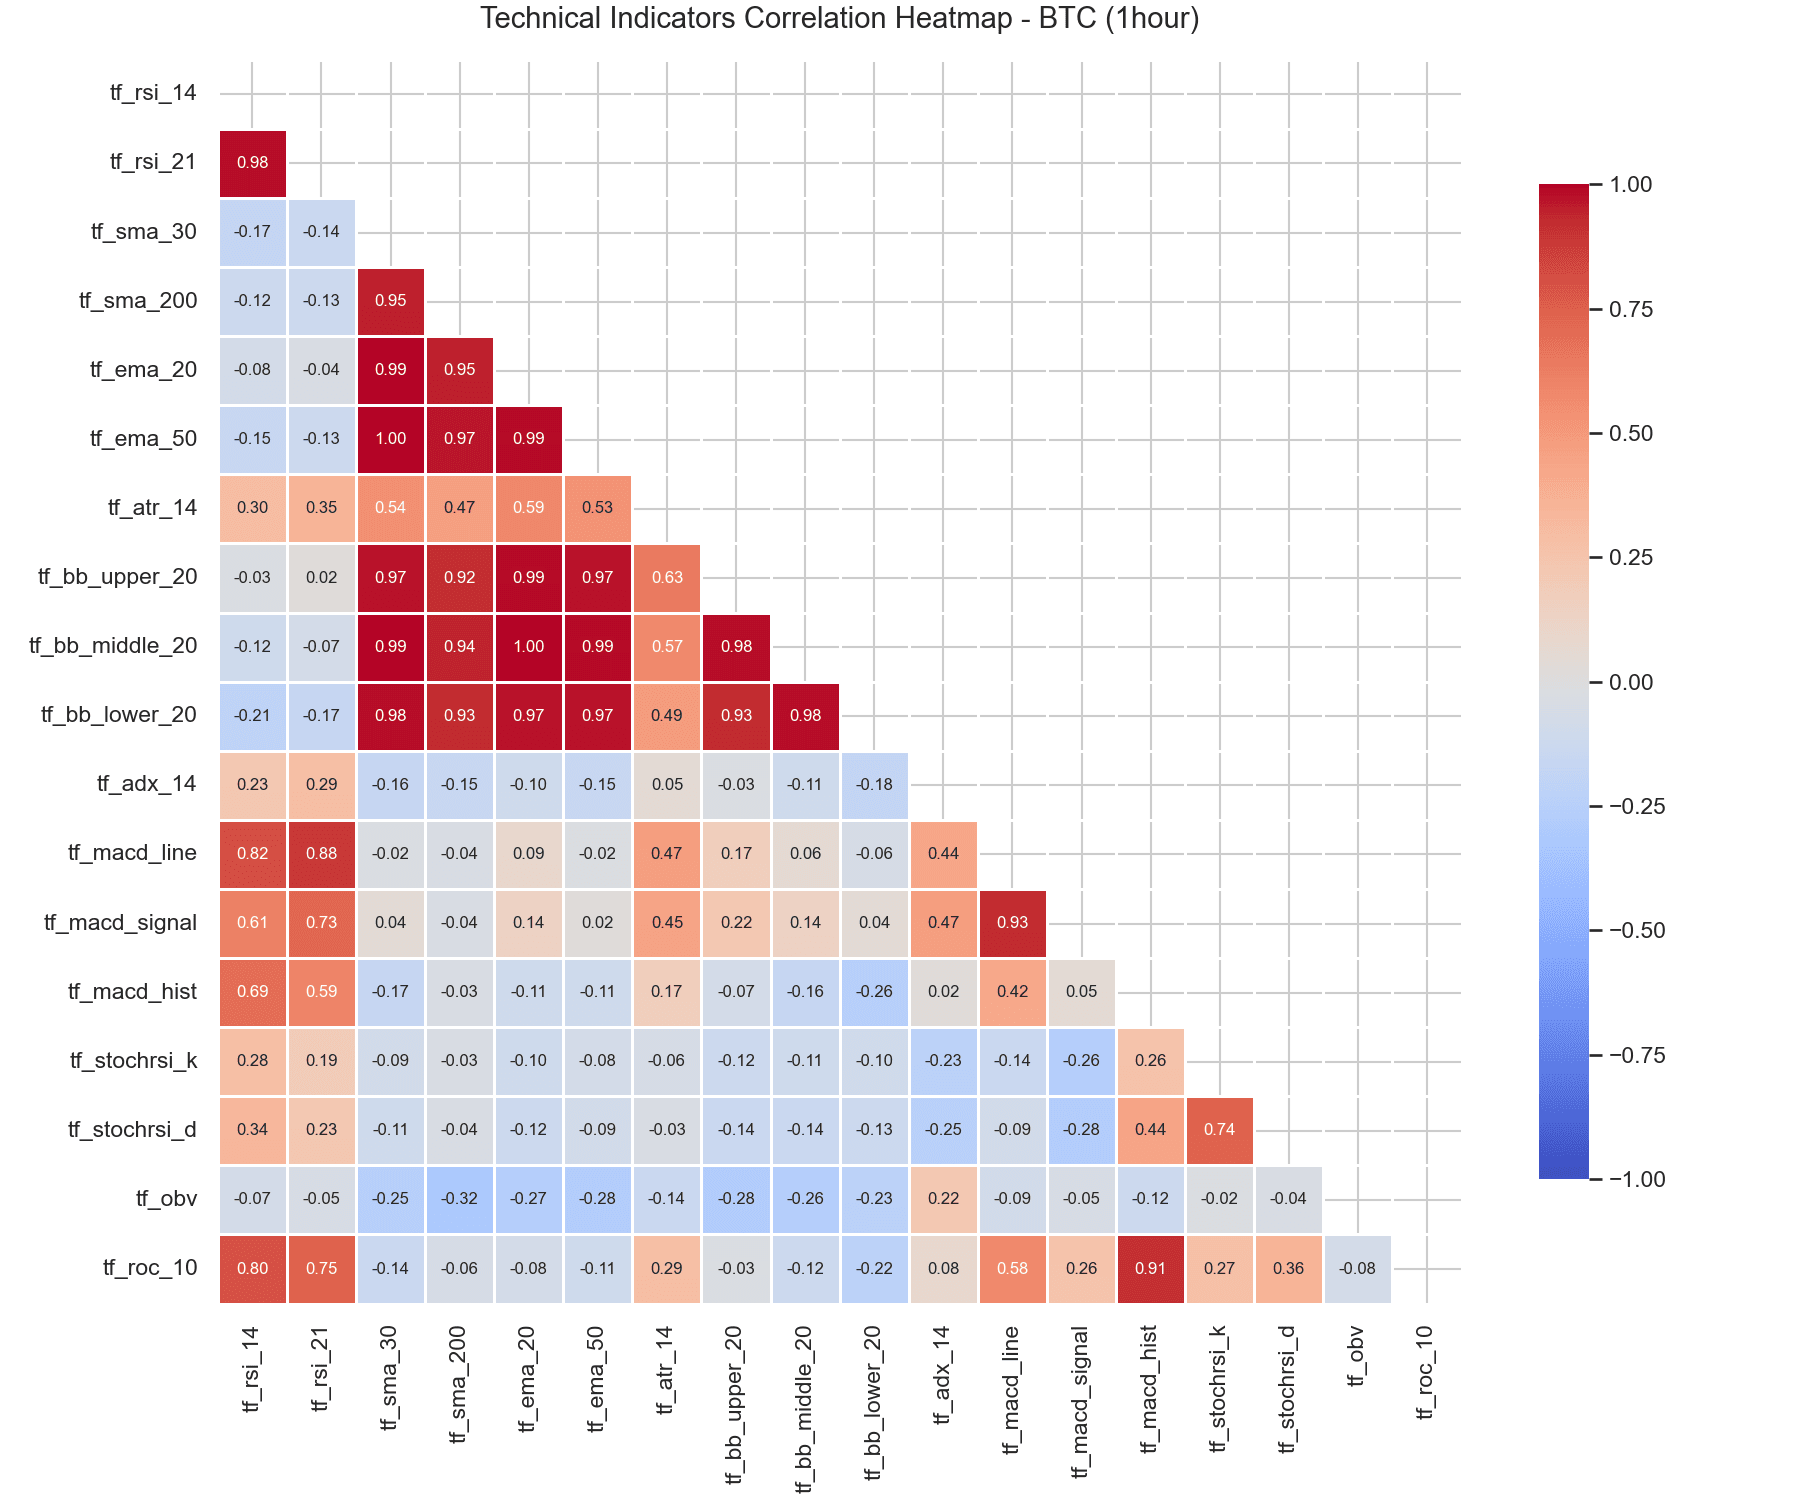
Figure 5.1: BTC 1-Hour Correlation Heatmap
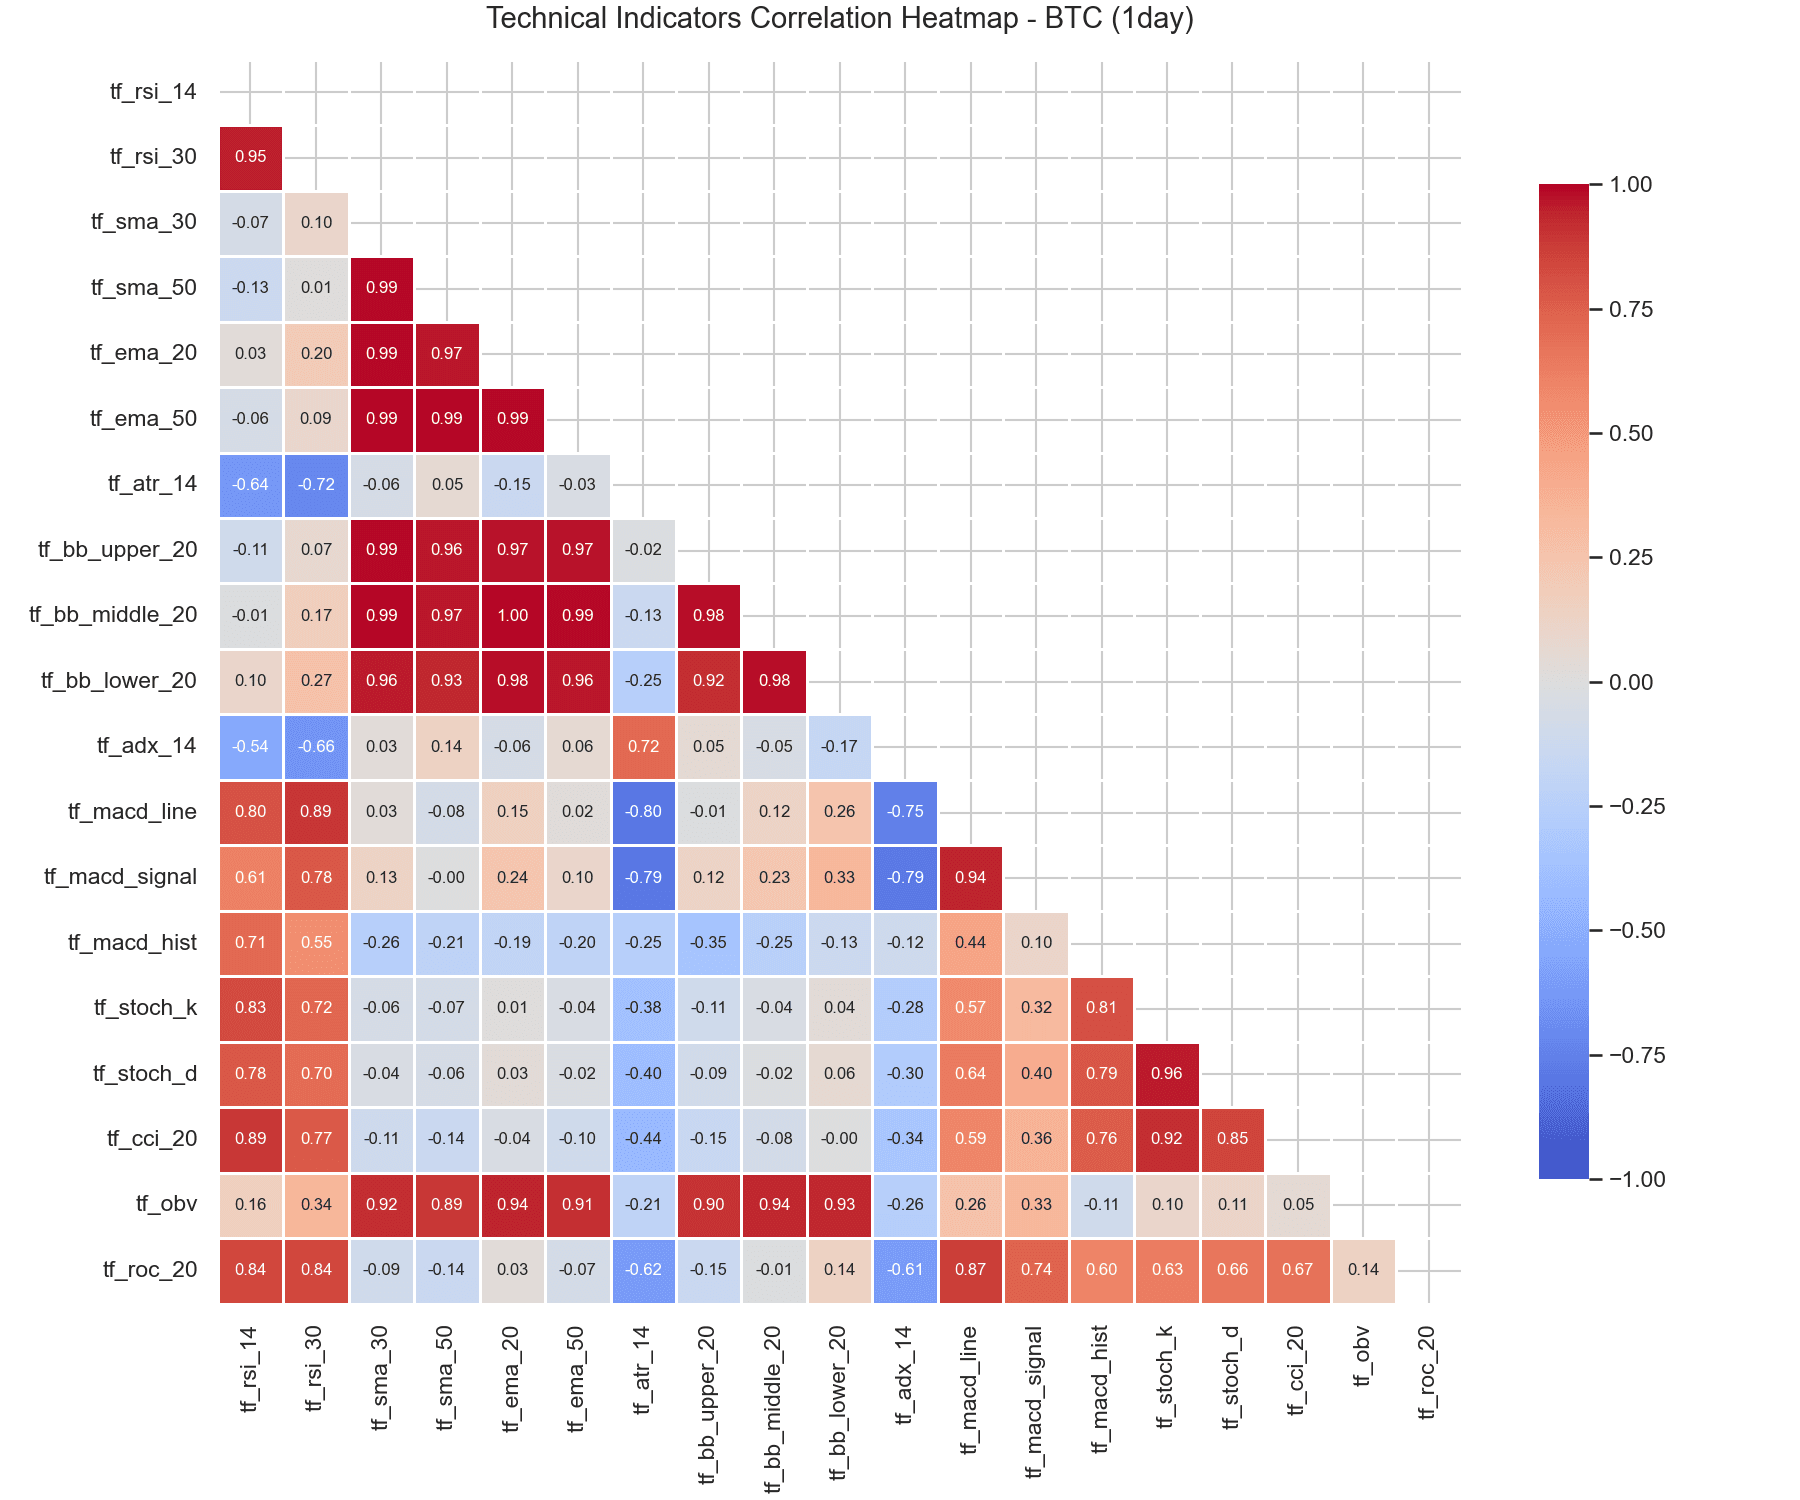
Figure 5.2: BTC 1-Day Correlation Heatmap
ETH Timeframe Correlations (1-Hour vs. 1-Day)
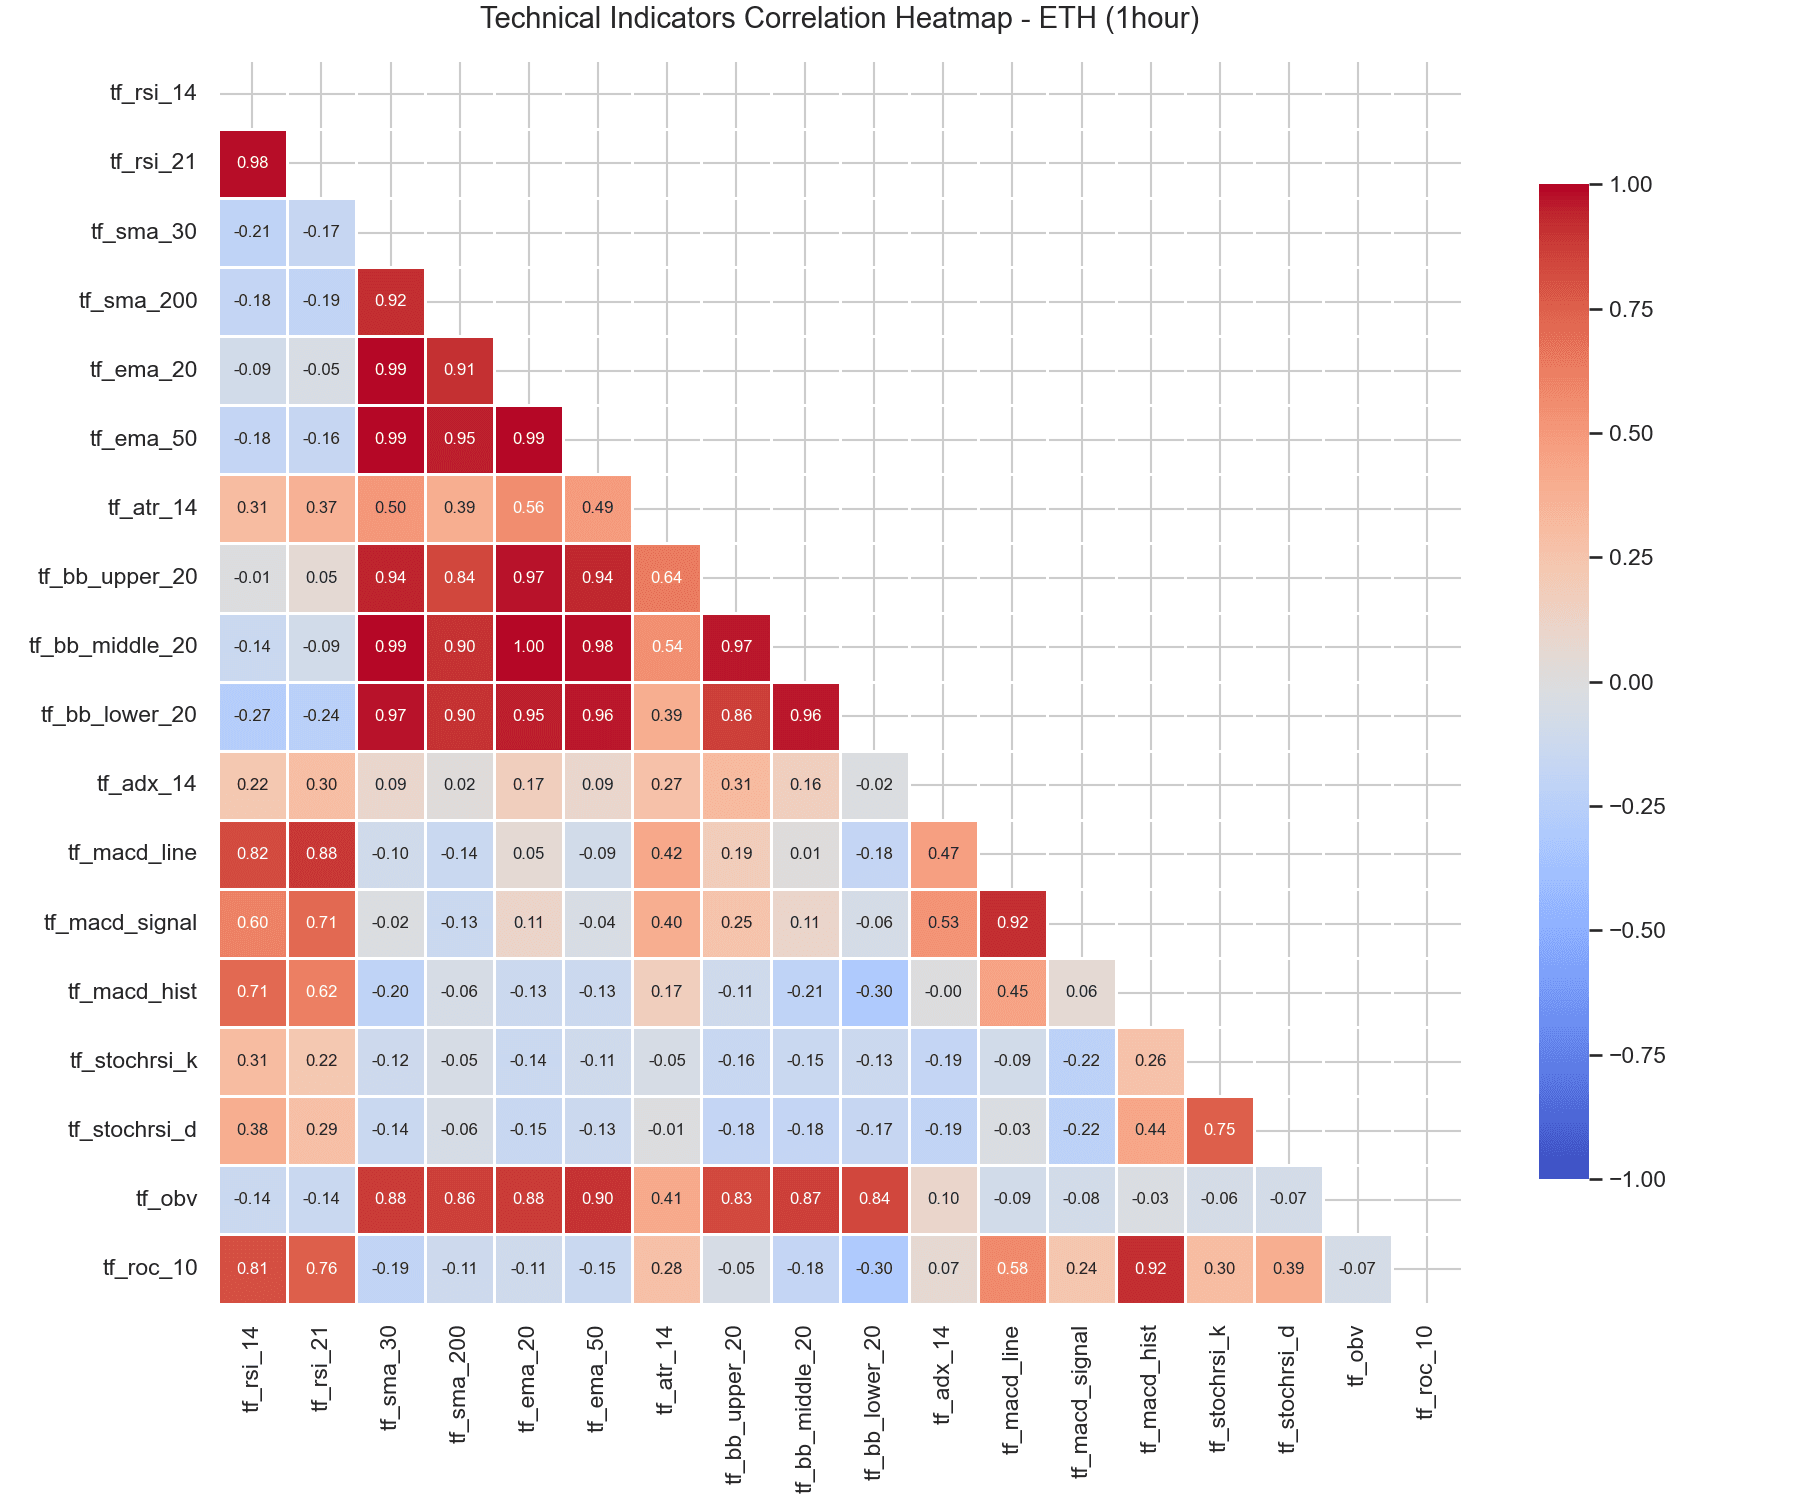
Figure 5.3: ETH 1-Hour Correlation Heatmap
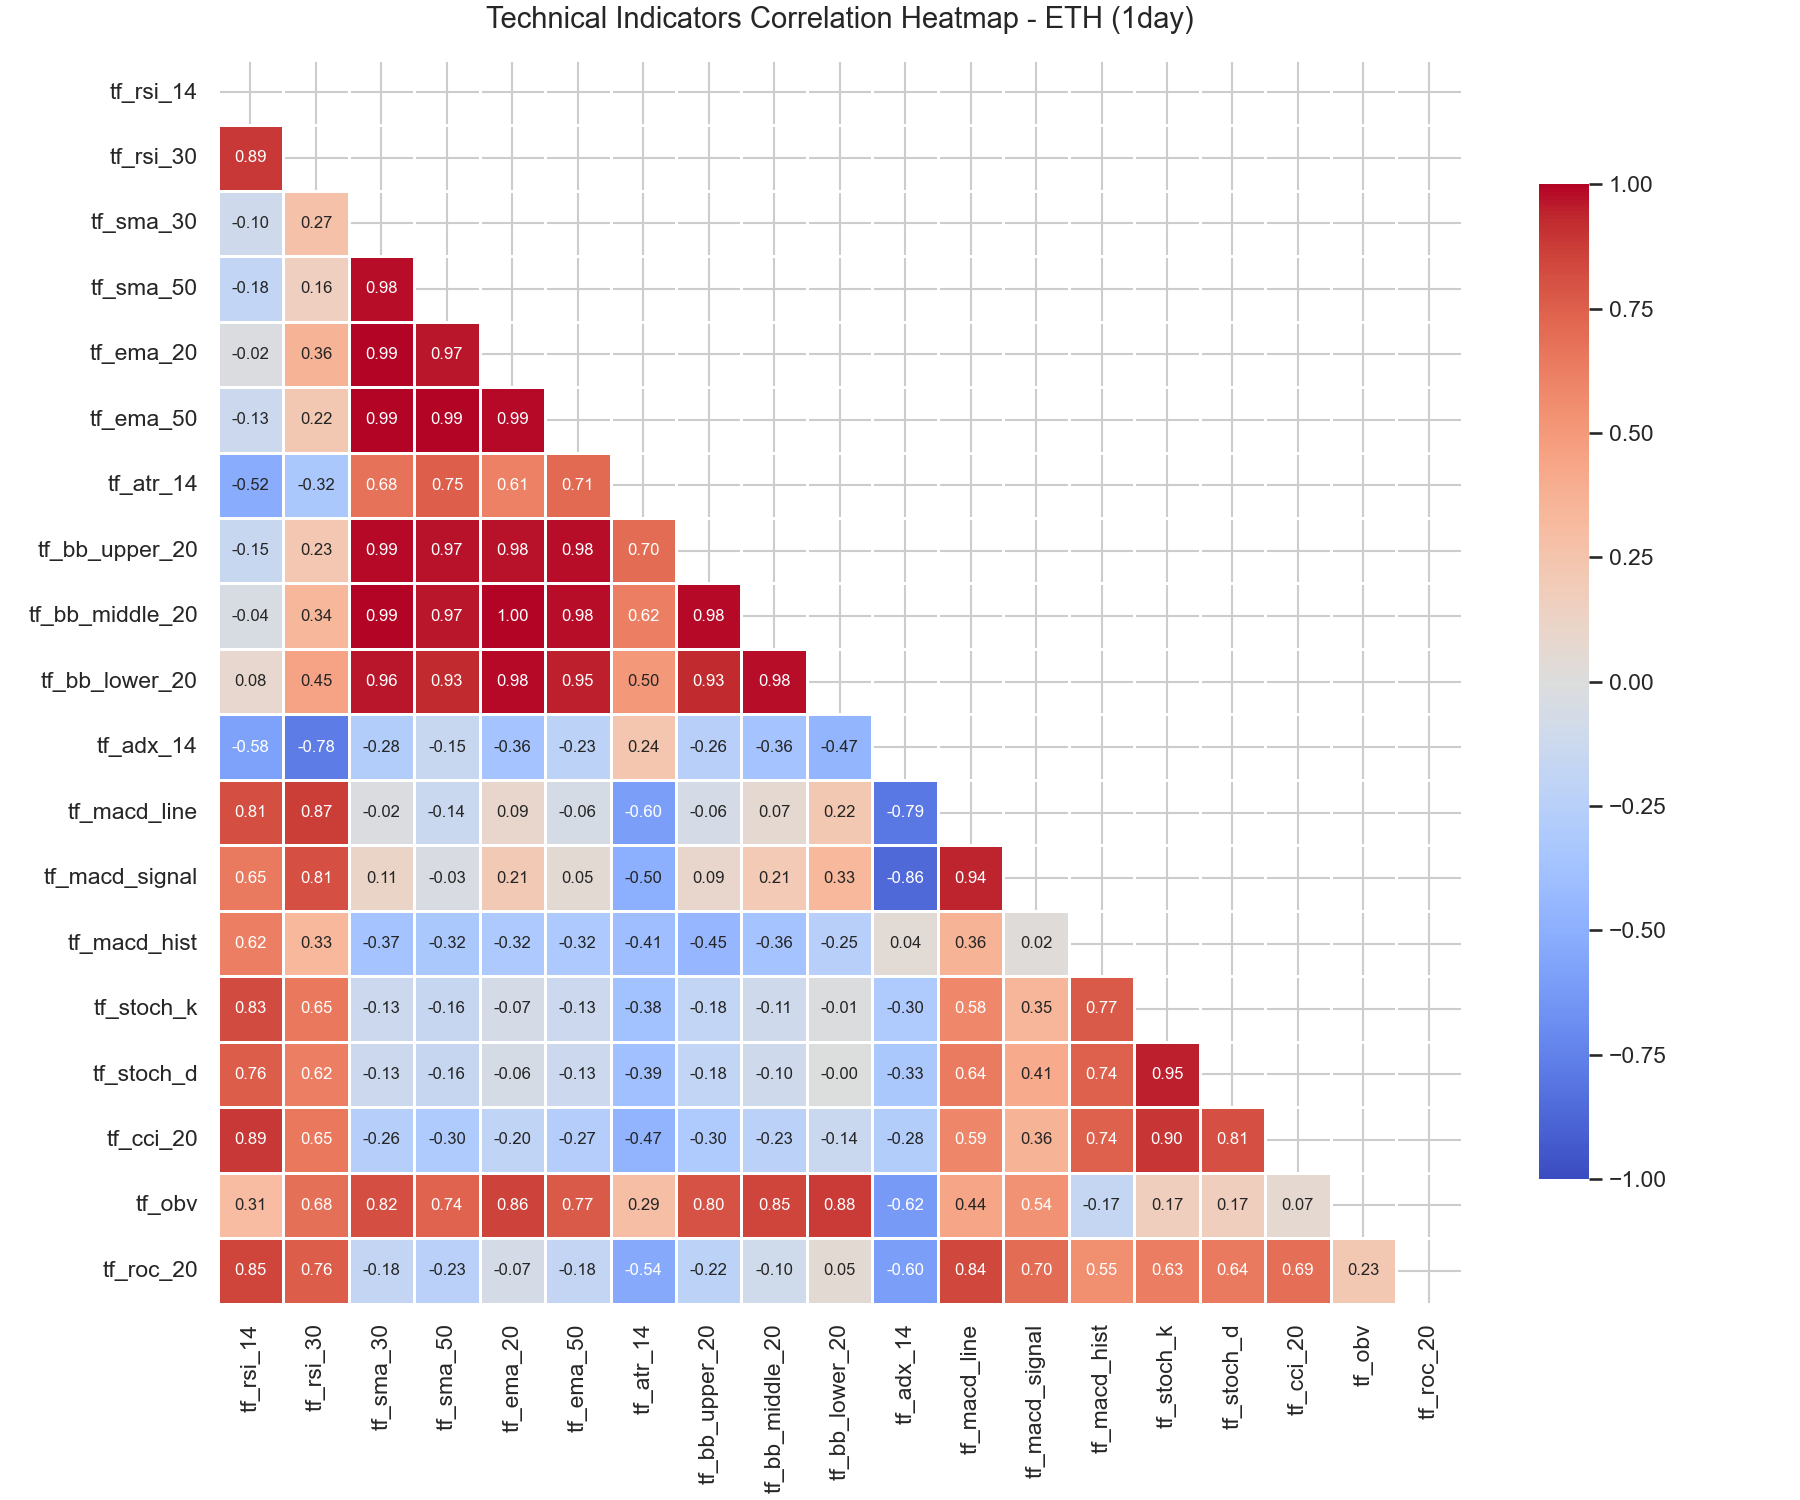
Figure 5.4: ETH 1-Day Correlation Heatmap
XRP Timeframe Correlations (1-Hour vs. 1-Day)
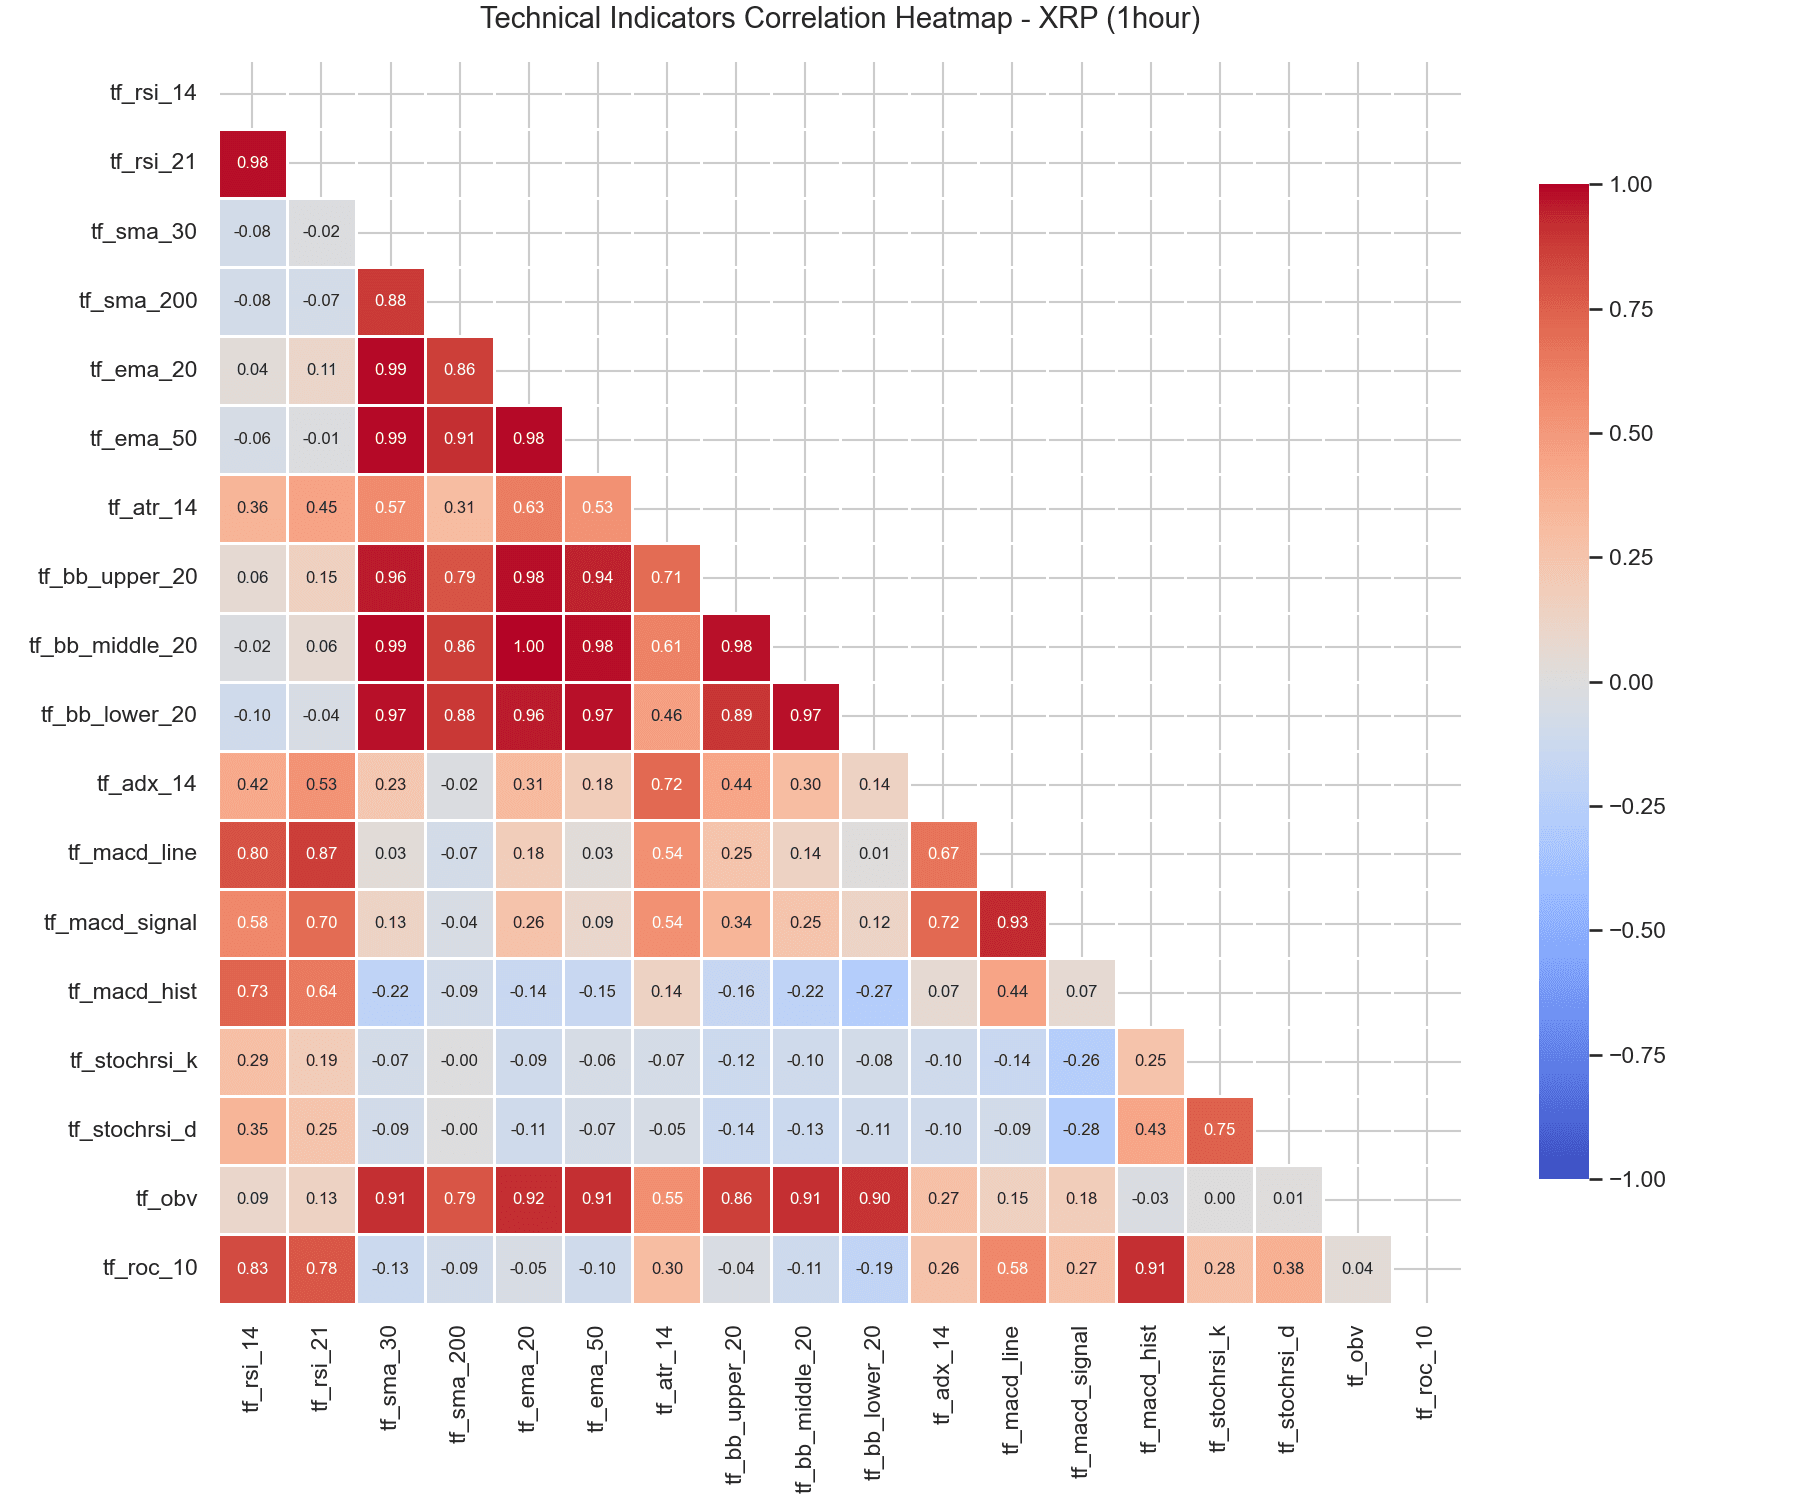
Figure 5.5: XRP 1-Hour Correlation Heatmap
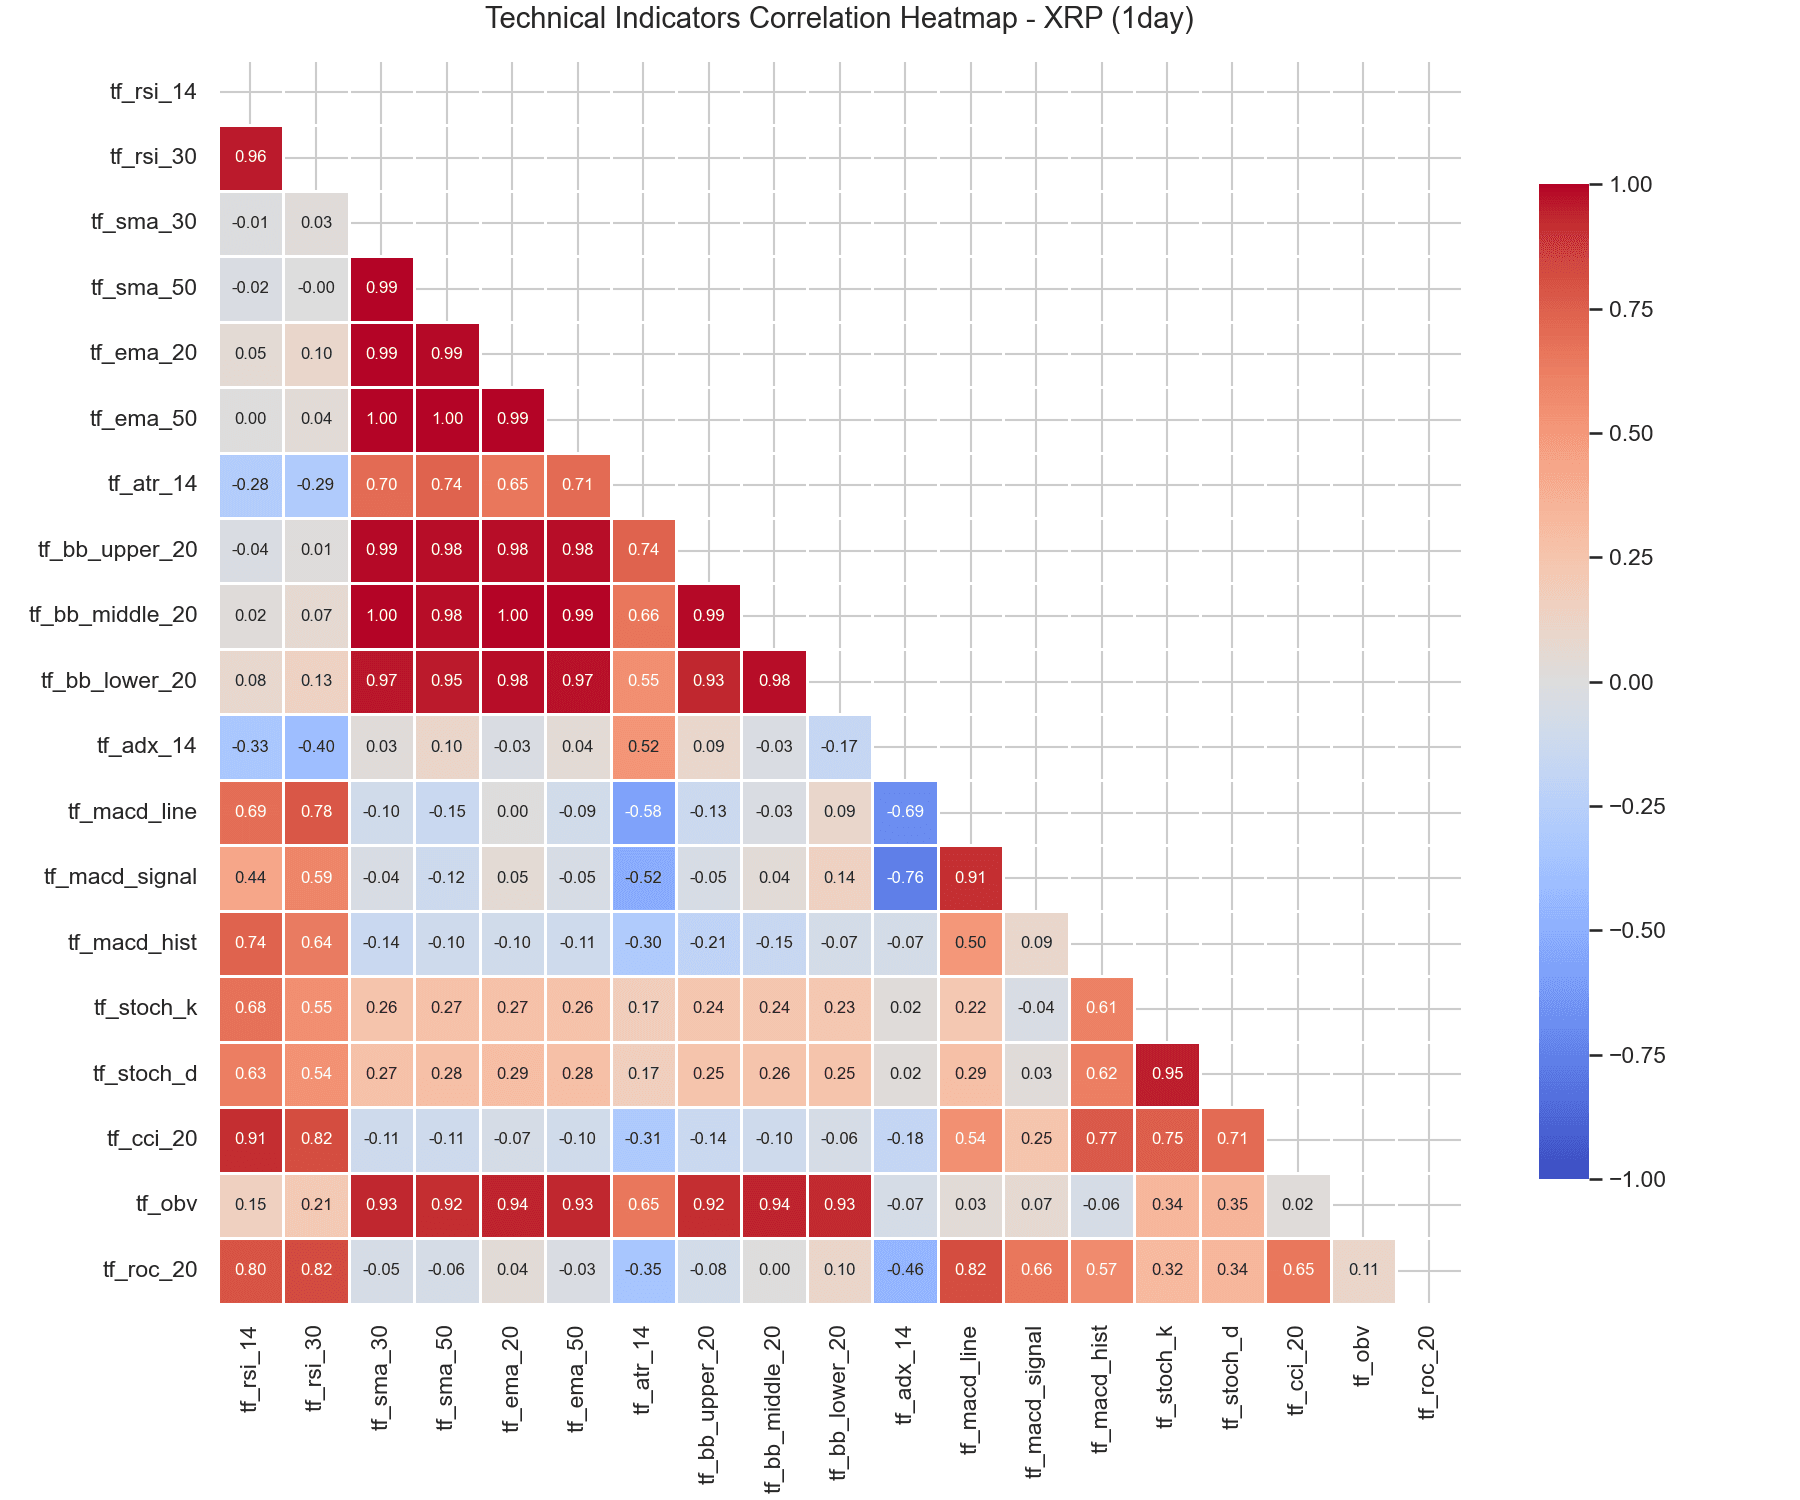
Figure 5.6: XRP 1-Day Correlation Heatmap
The heatmaps demonstrate that indicators of similar frequencies show moderate correlation (e.g., $r \approx 0.65$ between 14-period and 21-period RSIs), but remain independent of trend acceleration indicators, allowing the models to capture distinct momentum and reversion patterns.
6. TabFM Computational Overhead
TabFM requires 8.1 to 9.6 seconds per fold on the 1-hour timeframe (approx. 2 minutes per asset) and 8.2 to 8.8 seconds per fold on the 1-day timeframe (approx. 1.3 minutes per asset). Unlike traditional baseline models, TabFM executes a causal transformer block over the expanding context window to dynamically calculate attention weights for every prediction step.
7. Conclusion
This study demonstrates that the predictive power of Google Research’s TabFM tabular foundation model increases at longer prediction horizons. By leveraging pre-trained representations and in-context learning, TabFM achieved a competitive 66.04% accuracy on daily XRP contracts, outperforming all trained baseline models. The quantitative analysis shows that the primary drivers of crypto prices undergo a structural shift across timescales, moving from hourly momentum continuation to daily overbought corrections.
Leave a Reply